CS 34 - Project Milestone
Ray Di Ciaccio
Yoon-ki Park
Classifying Inrush Currents for Device Identification
Comments So Far | Accomplishments | Methods | To do | Conclusions
Comments:
Our plans have changed quite a bit from the initial presentation. The original plan was to use regression as a means of extracting useful features about the data. Unfortunately, after collecting our training data and seeing the difficulties that the data presented, we realized that regression would probably not work especially well. The main difficulty that arises has to do with the effect that AC (alternating current) has on the data we collect from the oscilloscope. The inrush peak for a device like a lightbulb, is proportional to the amount of instantaneous current available when switched on. In the case of alternating current, the magnitude of current that is available from the socket is sinusoidal with a frequency of 60Hz. Therefore, 120 times a second, there will be times of peak current and zero current, each 90 degrees phase shifted from each other. When the device is turned on at the peaks, the inrush current is greatest. When the device is turned on at times of zero current, or "zero crossings," the inrush is barely measureable.
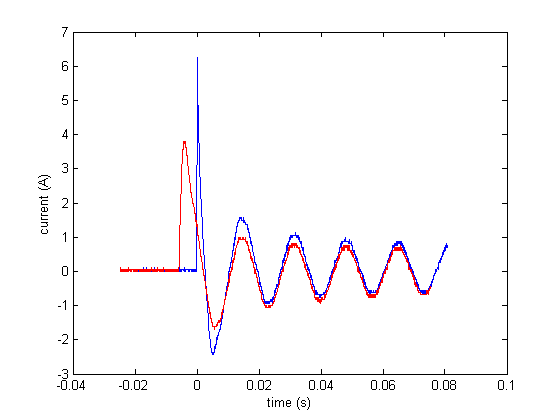
This results in two things: (1) there is a different amount of time between the initial inrush peak and the second peak (for an example, see the image above). And (2) the initial peaks can have varying magnitudes (see above image). We felt that both of these results would make extracting meaningful feutures via regression problematic. Instead we have devised a two-fold feature extraction scheme, which is outlined in the "Methods" section below. For classification using kNN, we wish to give one of the features extra 'weight', because we feel it is a strong feature. This will probably involve using some other metric, rather than Euclidean distance. This is all discussed below.
-top-
Accomplishments:
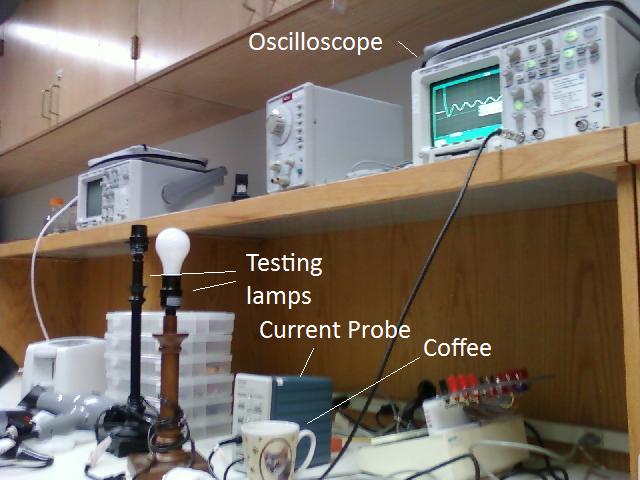
- Collected a body of training data by using the oscilloscope (see below): we have 110 training example spread over 3 device types (incandescent lightbulb, fluorescent lightbulb, and small table fan). We plan to add one or two more device types before finishing the project.
- Implemented a feature extraction algorithm that calculates the current peaks in the signal obtained from the oscilloscope.
- We understand where our project is headed now.
- Gained a deeper appreciation for the difficulties of working with real-world data.
-top-
Methods:
Feature extraction
For each example curve:
- We begin with some preprocessing during which we find the global maximum of the example curve; we remove all data from before this point because this is the inrush current peak. We then take the absolute value of all current values (because AC gives us both positive and negative currents).
- Our algorithm for feature extraction calculates the peaks of the current signal as follows:
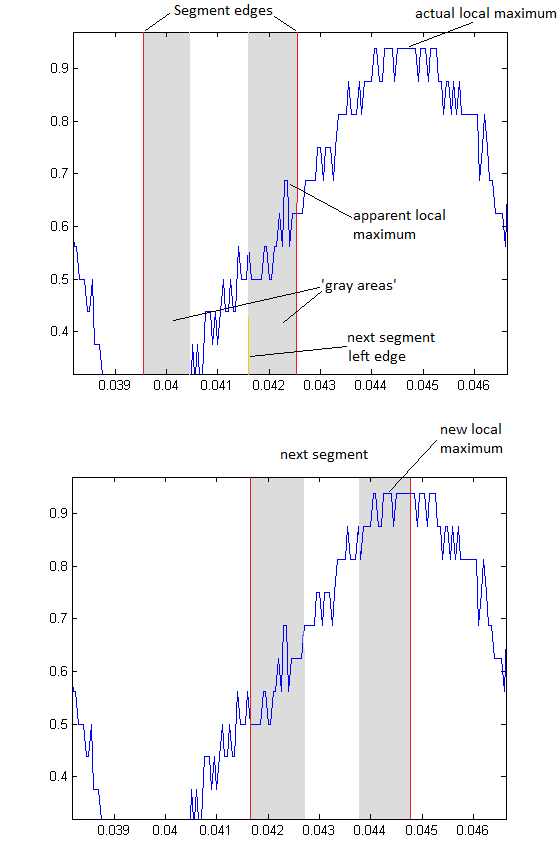
- We examine the curve incrementally in 3 millisecond segments (this is our 'step size'). On either edge of the current segment, there are 1 millisecond wide 'gray areas' or boundaries.
- We attempt to find the local maximum within the current segment. Noise becomes a problem, though. The way we determine a local maximum is when the maximum within the segment appears somewhere in the middle of the segment (i.e. not at either of the edge points). Unfortunately, within our segment there might be an apparent local maximum due to noise (see the image below). This is where our 'gray areas' come into play. If the apparent local maximum occurs within a 'gray zone', we wait to verify it when we move to the next segment. The new left segment edge is placed at the left edge of the 'gray area'. Now if the local maximum for the new segment does not appear in that gray area, then we know that it was only noise and that the true local maximum is elsewhere.
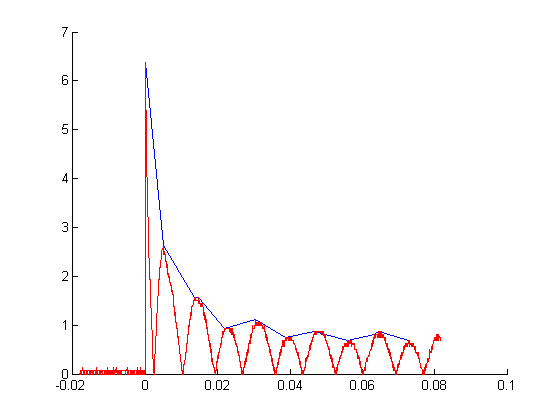
- We keep track of all the local maximums that we verify and use these as features for classification.
Here is an example of the results of our algorithm (our results shown by the blue line):
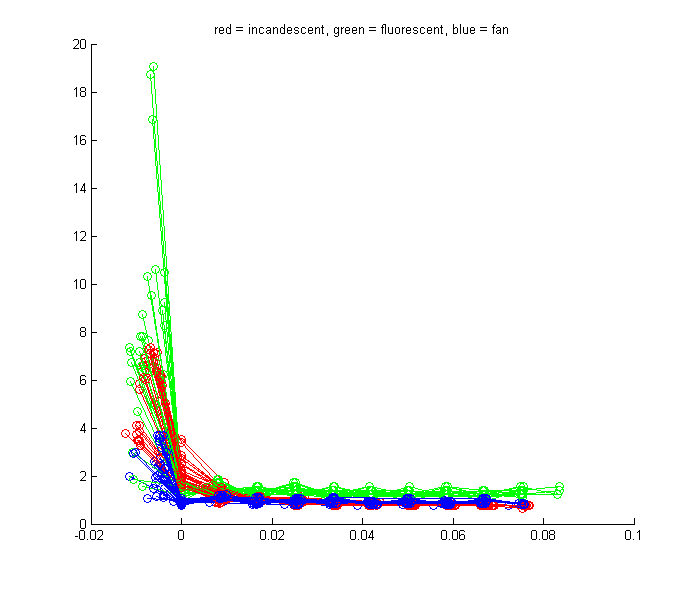
This shows the feature extraction results for all examples of the three device classes:
- We look at two of these peaks in particular: the first and the second, and the amount of time between them. The reasons for the variations in these are explained above in the "Comments" section. The value of the second peak and the amount of time between the first and second peaks shows a potentially interesting relationship:
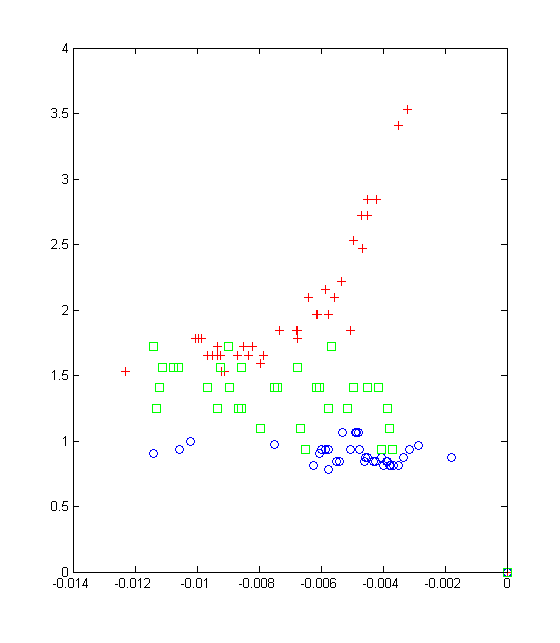
The different devices (red = incandescent, green = fluorescent, and blue = fan) seem to form separate groups when we plot this relationship.
- We also introduced the idea of a 'phase shift' for regularizing data. In order to obtain a clearer picture of the aforementioned relationship, we calculated a phase shift for the fan data. This involved identifying the 'turn on' point, finding the distance in time between that point and second peak, and then modding this value by the wavelength, or period, of the current signal (0.0166). This allows us to account for the the device being turned on at different points in the supply current's cycle.
-top-
To do:
- Implement kNN with a different metric that gives greater 'weight' to the relationship between the value of the second peak and the amount of time between the first and second peaks.
- Use the phase shift calculation on incandescent lightbulb data and plot against original, 'unshifted' incandescent data in order to further see its effects.
- Clarify exactly what features will be used for classification.
- Collect additional data using the oscilloscope.
-top-
Conclusions:
We feel satisfied by where we are at this point in the project. We've collected a solid set of data, which was one of our milestone goals. We do intend to collect some more data in the coming weeks, as well. Our other milestone goal was to have our regression algorithm working. However, because we felt that regression would not suit our needs, we turned to the feature extraction algorithm presented above. Thus, we feel we've met both of our milestone goals.
We certainly ran into difficulties with our original plan, and as a result our idea of the features for classification is somewhat rough. Though this puts us slightly behind where we had planned to be, all that remains is classification -- and this should not be too difficult. We feel confident that we will have plenty of time to complete this project.
- Yoon-ki Park and Ray Di Ciaccio
-top-