

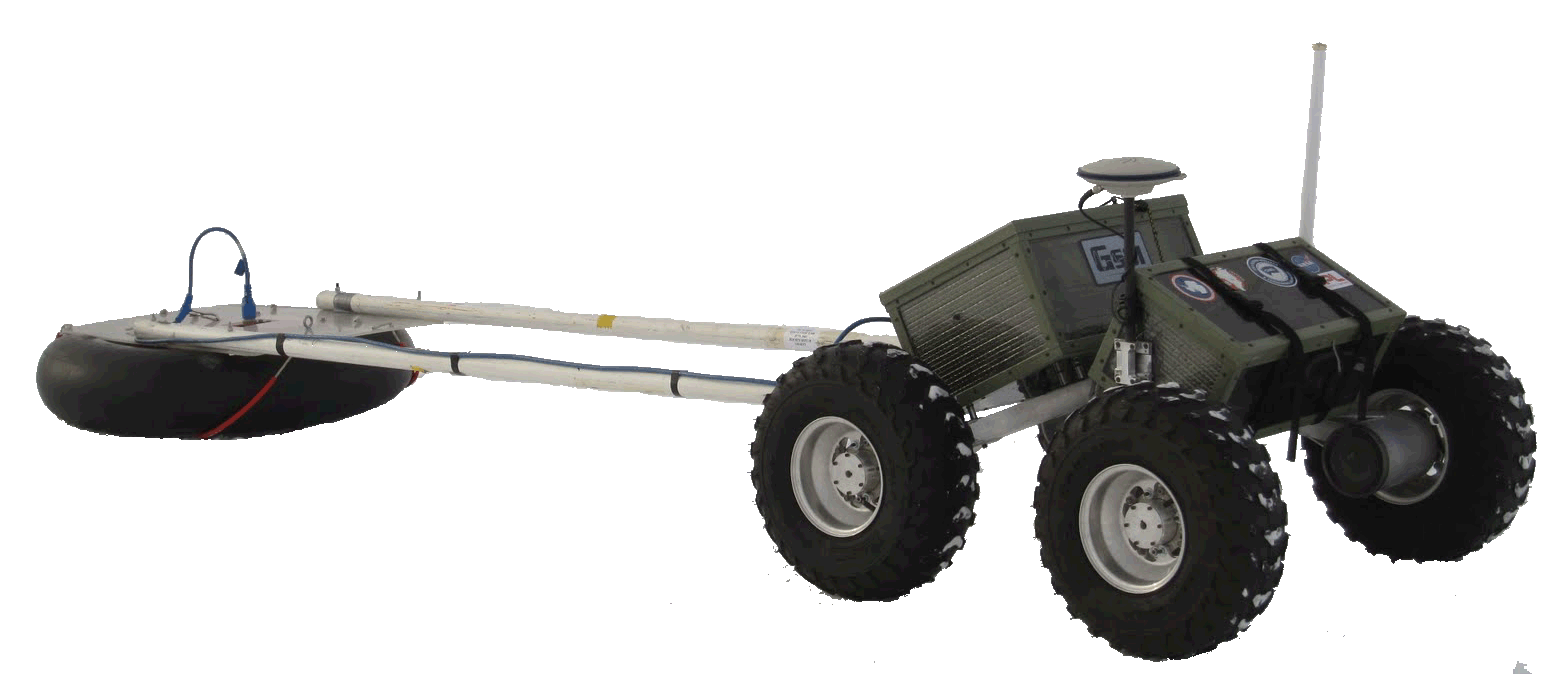
The purpose of this project is to apply current/new machine learning algorithms to ground penetrating radar data in order to interpret and classify reflection signals. A crevasse is a crack in a glacier posing hazards to NSF Over-snow Traverse vehicles, which are crucial to the mission of supporting science in Polar regions. Though successful,the current methods impose great risk to both personnel and expensive stuff, and are unreliable. We propose an autonomous, GPR towing mobile robot, named Yeti, to carry out crevasse detection surveys. A proposed survey route will be accessed by Yeti as GPS waypoints, and he will explore this route by continuously analyzing the GPR data generated by the unit in his tow. This analysis will be based on image processing and machine learning in order to "decide" whether a radar profile constitutes a crevasse, or safe snow for crossing.
The structure of the data is interesting, in that both axes can be translated into other units, eliminating or creating a time-dependence. For example, for a general radargram, the x axis is "scan number," which is simply a vector of amplitudes received by the receiver during the time window (120 ns). However, since the radar unit is moving at a known, fixed speed (usually 3 mi/h), the units on the x-axis can also be distance. Similarly, the y-axis represents "time," referring to the time each reflection from below is arriving at the receiver. Again, knowing the time window mentioned above, and the dielectric constant of snow/ice, these units can be converted to depth. All of our radargrams have depths of 12.5 m for 30 cm depth resolution. This point is important because it may affect the necessity of algorithms that can handle sequential data.
There are three "features" of GPR data that the radar operator looks for. These are visual features interpretable by the human brain, and may not necessarily constitute all possible features that could be used for learning.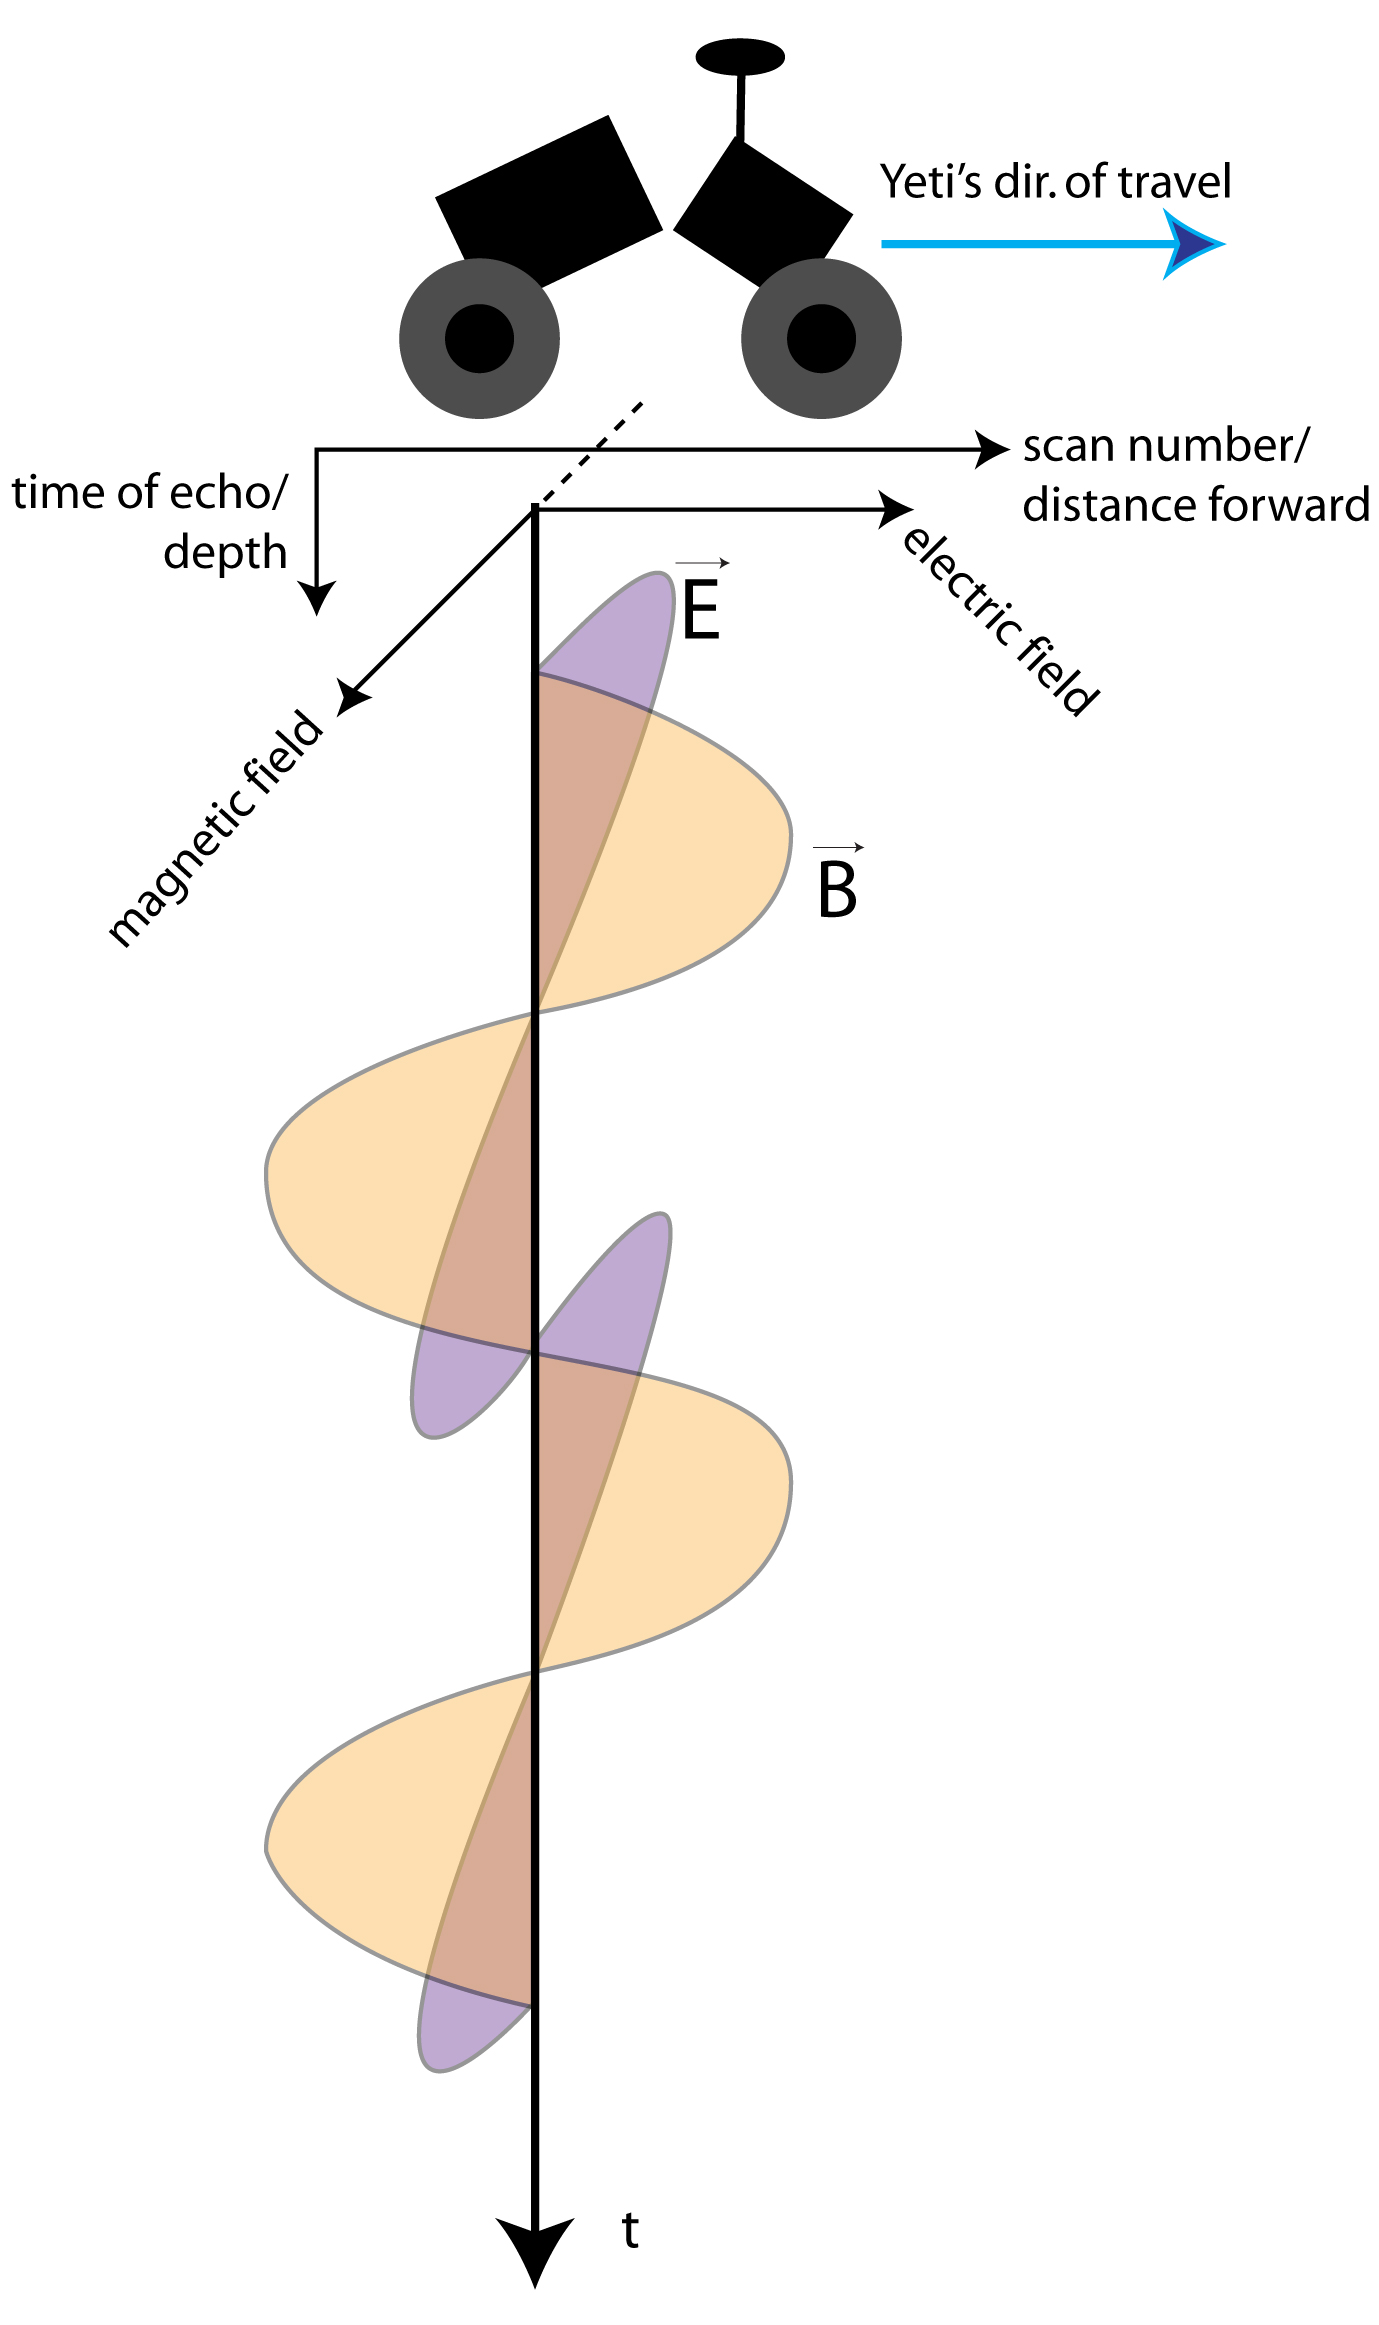
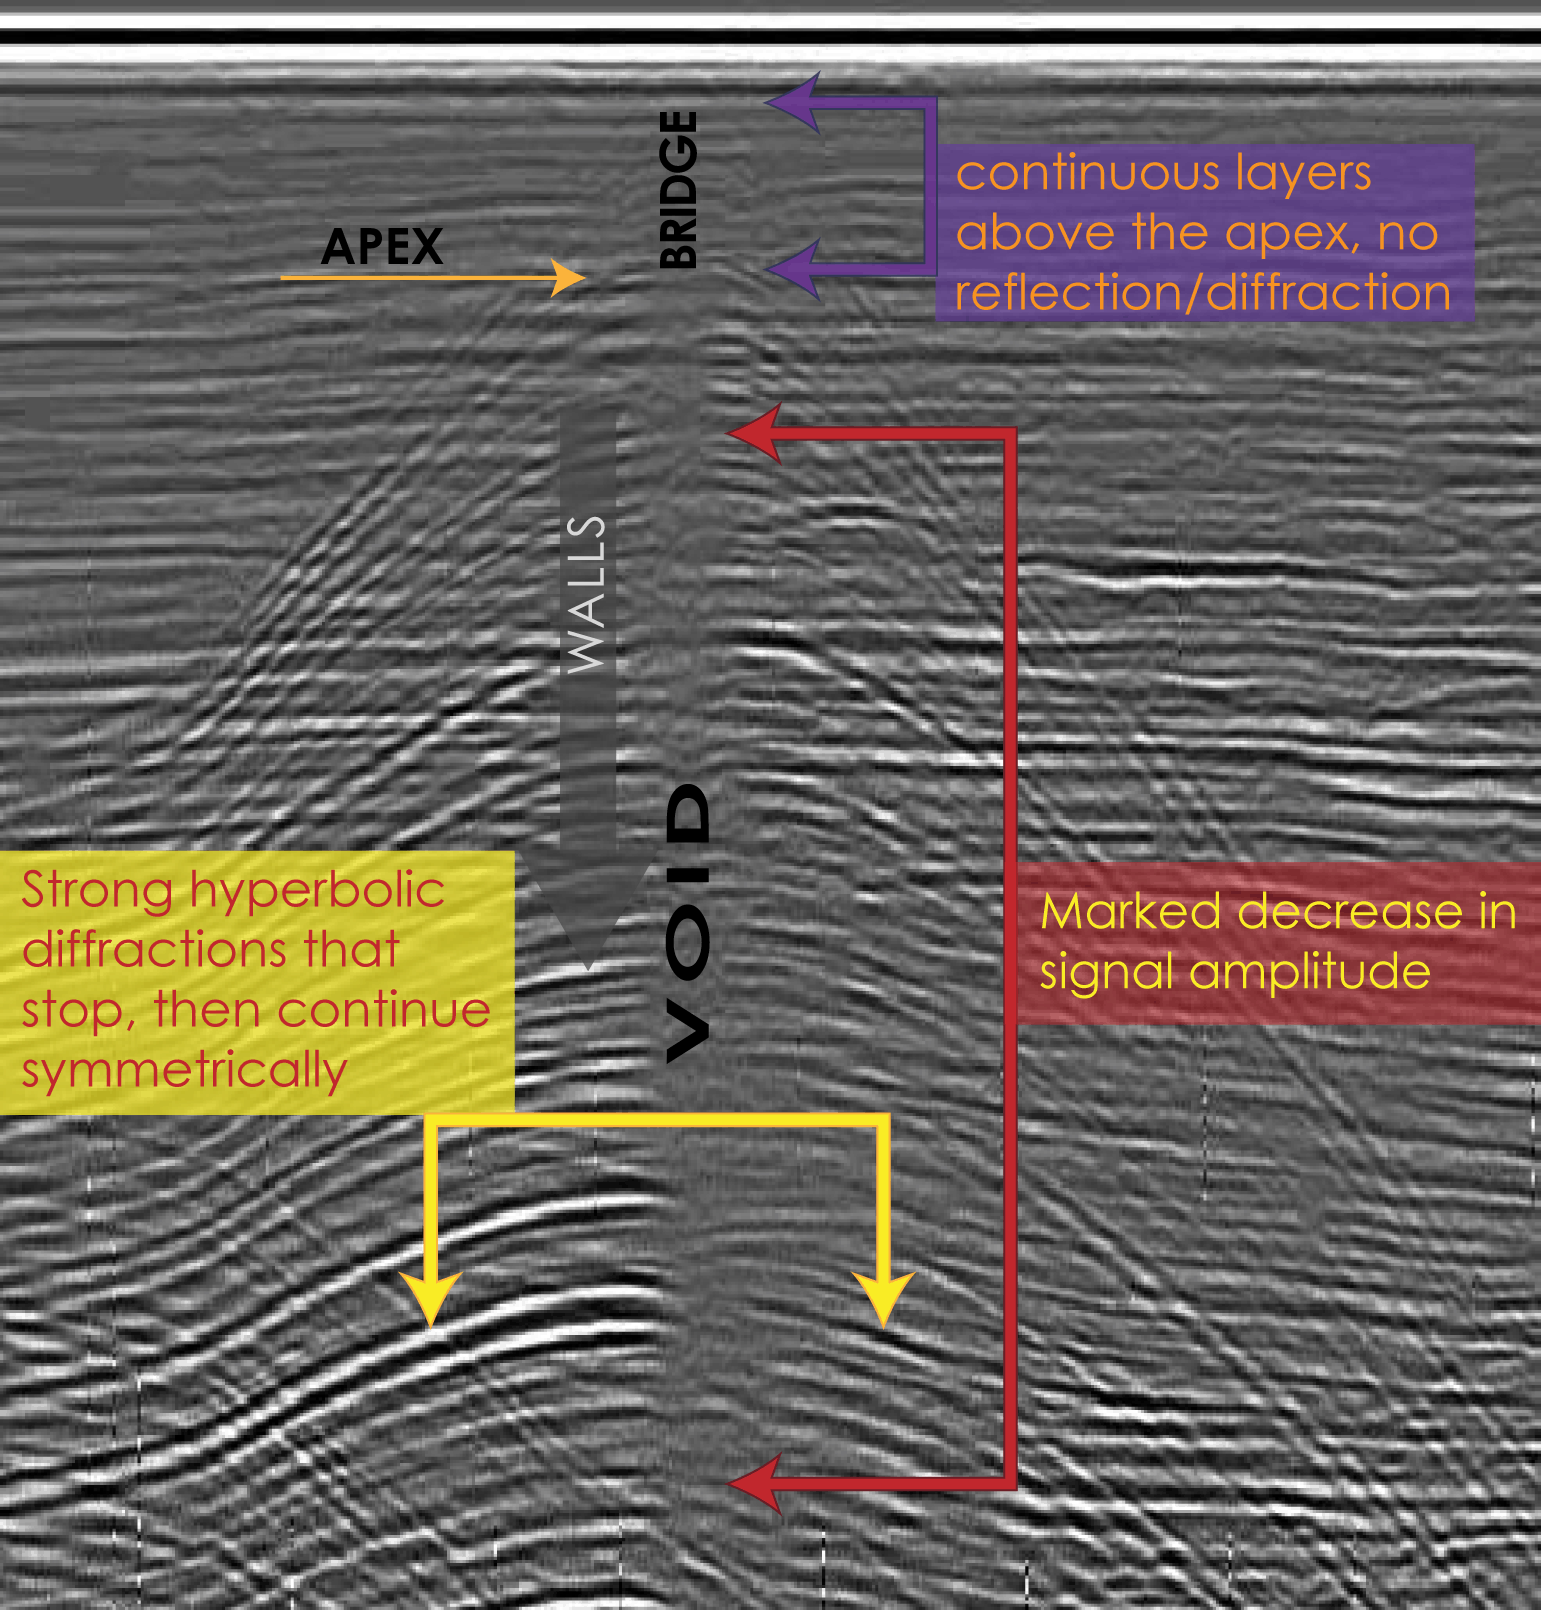
1. The first is strong, hyperbolic diffractions from the interface between two media with differing dielectric constants. Their hyperbolic shape originates from the type and orientation of radar antennae used. The current model has two dipole bowtie antennae, and their fields are oriented such that energy is preferentially aimed in the forward and backward directions, and its maximum pointed straight down, perpendicular to the ground. The projection of the resulting "cone" of energy resembles an elongated ellipse. This means that, when travelling forward toward a feature in the ground, the energy from the transmitter will reach the feature before the actual radar unit, reflecting back amplitudes proportional to its distance from the GPR. As the radar gets closer to an underground feature, it's reflections increase in both amplitude, and time to echo back, and therefore they also appear closer to the surface.
2. The second corresponds to the void of air enclosed within the crevasse. As the radar eventually reaches the spot directly over the void of the crevasse, a prominent decrease in return signal amplitude occurs, and corresponds to the width of the crevasse. This data pattern is symmetric about the crevasse. This pattern could be characterized by a power value, such as power spectral density, which does not require fourier transforms. This method may be more successful than a simple amplitude threshold approach, as snow density, water content, and other parameters often change throughout a glacier.
3. The third is presence and state of a "snow bridge." After a new crevasse forms, the winter accumulation period allows snow to drift over the opening, and harden. After several iterations of this, a bridge of snow will form accross the opening. As the crevasse ages, this bridge may begin to sag due to increasing weight in the middle, and may eventually break, causing complex inner geometry of the void. Snow bridges are characterized by a continuance of the smooth undulating reflections consistent with debris and crevasse-free snow and firn. In these layers, the dynamic range of amplitudes is greatly reduced, and reflections are slow and wave-like, with zero average slope.
The goal of learning in this context is to analyze incoming GPR data, and make a decision about whether the data represents a crevasse, or a crevasse-free area. In essence it is a binary classifier, though more classes will be added later in the author's PhD research. These classes would include "crevasse thin enough to cross" vs. "crevasse width too great to cross" and "crevasse at shallow strike angle" vs. "crevasse at near-perpindicular."
To the author's knowledge at this point, there are two main learning algorithms that show promise. A support vector machine based classifier would be useful if performed on a "slice" of GPR data [3]. A slice of data would constitute a certain distance travelled by the radar, and the depth reached by the GPR. The slice would be a matrix of reflection amplitudes at increasing, fixed units of time/distance.
The second interesting algorithm is a Hidden Markov Model (HMM). HMMs are used when data has a sequential nature, and time dependence is required. As mentioned above, this may or may not apply to the GPR data, as the time dimension is not necessarily the most useful to work in. Several studies have been done on HMMs for landmine detection with GPR [1,2]. If we were to consider each vector of reflection amplitudes as one slice of data, with a time component satisfied by the markov model, the algorithm would hopefully consider the order of features, or observables, present in order to classify an area.
By the "Milestone" date, May 10 2011, I expect to have coded, or obtained code for, all algorithms in question. Preliminary results for each algorithm should be ready to present. The final results should include a pro/con table of each algorithm, and modifications to any that were required.