The main goal of the project was to adjust the letter values iteratively until each of the letters had a negligible effect on a player's winning chances. In order to measure a letter's impact on a player's winning chances, it was necessary to perform some machine learning to determine the correlation drawing certain frequencies each letter had with winning. I wanted something simple that would keep each iteration of the main algorithm computationally cheap. Therefore, I performed regression, Naive Bayes, k nearest neighbors, and K Means classification in order to find ways to determine which direction the letter values should be changed (incremented or decremented). Unfortunately, none of these methods were able to predict with much accuracy the winner of the game, given the tiles drawn by the players. The two most likely reasons for this are (1) there is indeed only a very slight correlation with certain combinations of tile draws and winning, or (2) my data set is not extensive enough to observe the correlation.
Concerning the data set, the main challenge of this project turned out to be logistics of the Quackle program itself. I had expected to be easily able to simulate larger numbers of games using a program that is present in the Quackle source code, testharness.cpp. Although I was able to build the main GUI application, there were issues making this test application. I have spent many, many hours over the last month trying to fix this and consulted everyone that I thought could have some insight on the issue. Most of them were just as puzzled as I was. Without this element of the Quackle program, it was difficult to implement machine learning methods that require an iterative adjustment to the letter tile values, since my data was generated one simulated game at a time, by hand (arduously) in the Quackle GUI. In all, only 300 games were simulated, resulting in 600 data vectors, which may not be enough to observe some trends. So I had to focus on predicting the winner of games from a fixed-size data set.
The result may be an adjustment to the goals of this project. In order to exploit the fixed data set that I have of a modest size, I will try to determine other features of the letter draw that can be used to predict the winner of the game.
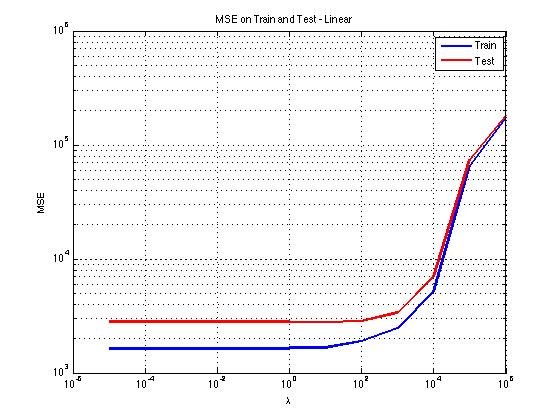
Above are the train and test performance for various values of Lambda for the linear model. This regression is on the final scores of the game, given a row vector of length 27 corresponding to the number of each letter tile drawn during by the player during the course of the game. The linear model performs best with a low value of Lambda, and manages an average prediction accuracy of between 40 and 50 points, which is not impressive, but it is significantly better than standard deviation of the final scores, which is approximately 62.
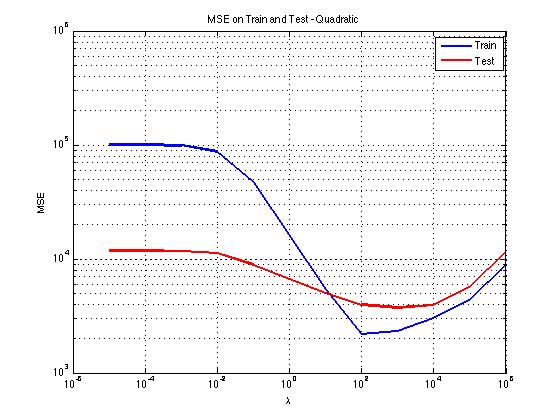
The analgous graph for the quadratic model shows that the quadratic model does not outperform the linear model - at its best performance on the test set, the standard error resembles the standard deviation of the data, so it is no better than simply guessing the average score.
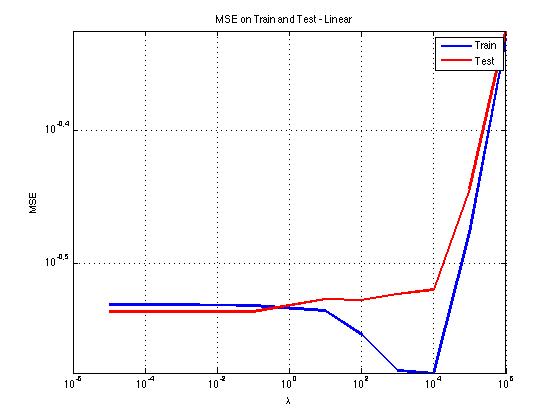
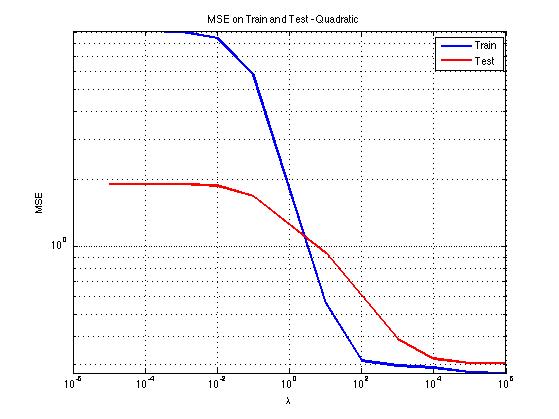
Regression was also performed on the win/loss result. This resulted in an average error of about .34 in the best cases, and, after rounding the result either to 1 or to 0, a prediction accuracy that tended to be no better than chance (50%).
Other familiar methods (Naive Bayes, k Nearest Neighbors, and K Means) all confirmed that it was difficult to predict the game result from the tiles a player drew - even when the winner and loser's tiles were paired together in one vector, the classification to choose the winner correctly.
This has some implications for my original goals. If I cannot show that winning and losing correlates to drawing certain tiles, then there is no basis for adjusting the tile values. I had expected to have much more meaningful results at this point in the project, but at this point, it might be for the best to change the overall goal of the project from determining the proper values of the tiles, to discerning what features actually can predict the winner. Possibilities include adding the turn the tiles were drawn as another dimension to the vector, and implementing more sophisticated machine learning techniques to predict the outcome of the game from tile records. In addition, any possibility of increasing the number of simulated games will be of high value in obtaining clearer results.