- Introduction
- The field of Music Information Retrieval (MIR) is a broad field in which researchers aim to learn about music, such as the structure of a piece, how various pieces compare to each other, and how to recommend music to listeners. There are both many tasks and approaches in MIR, and one song can be represented in several different ways.
- In our project, we are creating an algorithm that detects structure in a musical song. By structure, we do not necessarily mean verse or chorus. Instead, our algorithm should detect the same kinds of structure that a human eye sees when looking at the matrix that represents a song from our dataset.
- Dataset
- We plan to use a subset of the Beatles Dataset created by Prof. Michael Casey of the Department of Music at Dartmouth College. Each song is represented by a distance matrix of the squared-Euclidean distances between the song’s audio shingles. The audio shingles are comprised of 30 feature vectors, which are created by splitting the audio track into tenth of a second windows and extracting the mel-frequency cepstral coefficients (MFCCs) for each of the windows. [1] The following is a visualization of one song from the Beatles Dataset that has been processed to separate recorded zeros from non-recorded distances.
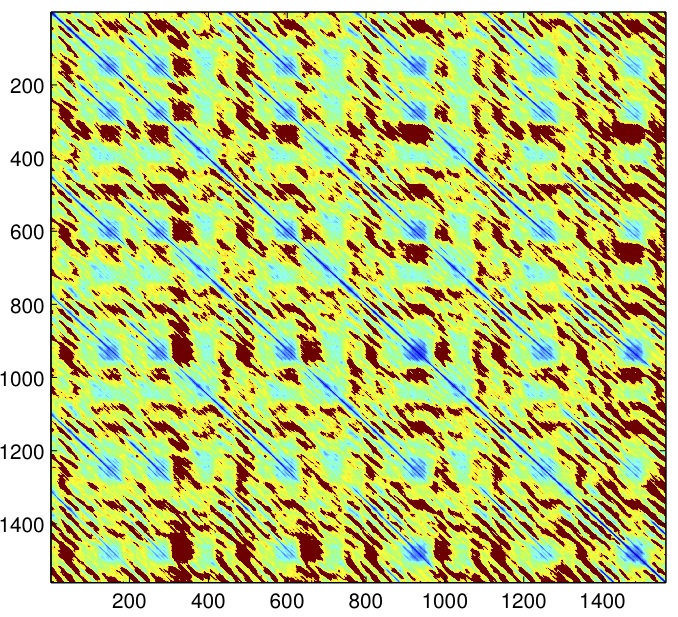
Fig. 1 - Example of Cleaned Song in Database
- Method
- The first phase of our algorithm will be to identify and extract suitable feature vectors. For our data, it has been observed that repeats in songs present themselves as diagonals. [2] Therefore instead of comparing whole sub-square-matrices, we will use just the diagonals of sub-square-matrices. Our next decision is to decide if we will arbitrarily decide the size of the sub-square-matrices or if we will learn their size from the datasets. For now we have decided to set the size of the sub-square-matrices. We have also decided to allow comparison of diagonals whose sub-square-matrices overlap in someway. The below left figure is a complete cleaned song from our dataset. The below right figure is all of the diagonals of sub-square-matrices of size 100 whose diagonals begin at entry (1,i) for all i from 1 to (n-100+1), where n is the number of rows (and columns) of the full song matrix. In this figure the rest of the matrix entries have been set to 0.
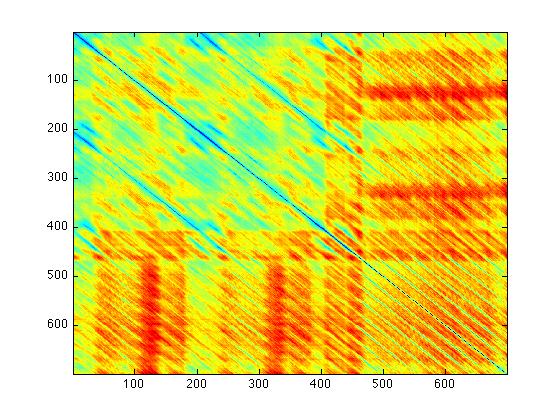 Fig. 2 - Cleaned Song |
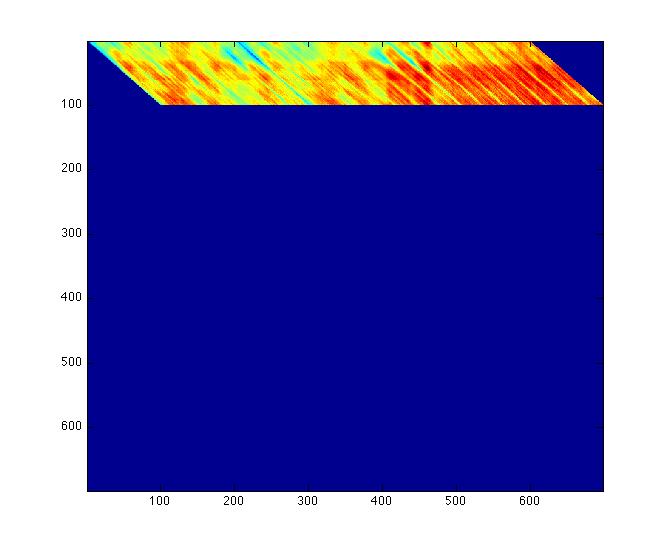 Fig. 3 - Isolated Diagonals (length 100) |
- We then note that, although our feature vectors are diagonals, we need to process these diagonals such that they are column vectors. Below is a visualiztion of the diagonals as columns.
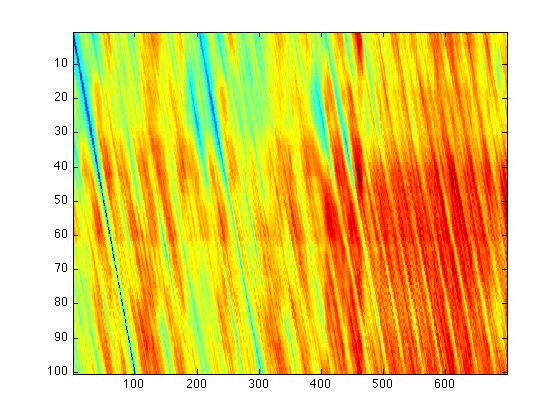 Fig. 4 - Isolated Diagonals (length 100) as Columns |
- Our goal is find the number of repeated sub-square-matrices in a matrix that represents a Beatles song. An algorithm that clusters similar feature vectors is a relaxed version of this problem. In the learning phase of our algorithm, we will use the unsupervised techniques spectral clustering. [3,4] This algorithm's input will be the adjacency matrix of a graph (with nodes and edges) which will be used to create the graph Laplacian and ultimately the spectral embedding. The above image is a matrix of feature vectors, which we will use to create an adjacency matrix for a graph with the diagonal's starting column marker as the nodes. As a first step towards creating this adjacency matrix, we computed the pairwise distances between every pair of diagonals. Below is a visualization of the resulting pairwise distance matrix (with a colorbar on the right to relate the colors to distances between the diagonals).
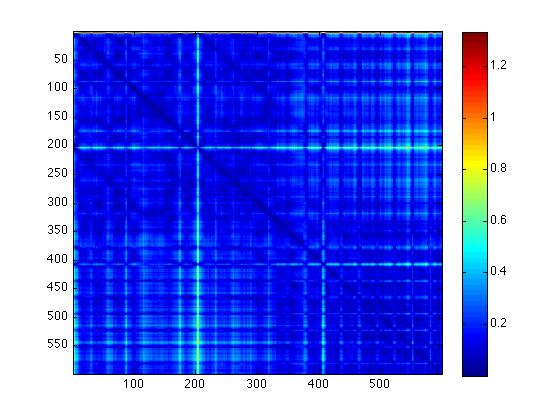 Fig. 5 - Pairwise Distances of Isolated Diagonals (length 100) |
- Revised Timeline
- We recognize that we are not nearly as far along as we expected. Our original plan was to perform spectral clustering on all diagonals of sub-square-matrices (of the same specified size) not just one band of diagonals as we have above. Unfortunately, our original plan of using all the diagonals was prohibitively memory intensive. Thus we need to make further decisions about our feature vectors. We could use all the diagonals in one band (as we did above), diagonals of all sub-square-matrices of a larger size, or compare a sampling of diagonals from all of the possible bands. Each of these approaches have drawbacks. If we only search one band, we are ignoring a large portion of each song’s matrix and we lose the ability to compare diagonals from different bands. If we use diagonal of large sub-square-matrices, we lose the ability to sense smaller structure in the whole song matrix. Furthermore, we also will again be ignoring a large portion of each song’s matrix. The last option of using a sampling of all of the diagonals is appealing but will require a careful method of selecting these diagonals as to be a representative sample. Keeping all of this in mind, our next step is to decide how to chose the diagonals that we will use in our clustering.
- Clearly this is not a setback that we expected, but once we have decided which diagonals we will use, we expect that implementing the spectral clustering to be fairly straightforward. One possible issue moving forward could be creating the appropriate visualization code that will clearly show where the algorithm detected repeated sub-square-matrices. We do believe that we will be able to complete a successful project with the following revised timeline.
- May 12: Finalize decisions about which diagonals will be extracted, begin algorithm outline
- May 14: Spectral clustering code completed, adapt visualization code appropriately
- May 18: Test algorithm on a few songs, create resulting visualizations
- May 21: Begin processing songs on the full algorithm and evaluating the results
- May 25: Final edit of Poster and printing of the poster
- May 29: Poster Session
- May 30 – Final: Write-up completed
- References
- M. Casey, C. Rhodes, and M. Slaney, Analysis of minimum distances in high-dimensional musical spaces, IEEE Transactions on Audio, Speech, and Language Processing 16 (2008), no. 5, 1015 – 1028.
- M. Müller, P, Grosche, N. Jiang, A Segment-based fitness measure for capturing repetitive structures of music recordings, 12th International Society for Music Information Retrieval Conference (ISMIR 2011), Miami, Oct, 2011.
- A. Y. Ng, M. I. Jordan, Y. Weiss, On Spectral Clustering: Analysis and an algorithm, Advances in Neural Information Processing Systems 14: Proceedings of the 2002 conference 2 (2002), 849 – 856. Retrieved from: http://ai.stanford.edu/~ang/papers/nips01-spectral.pdf
- U.
von Luxburg, A
Tutorial on Spectral
Clustering, Mathematics
and Computing 17 (2007)
no. 4, 395
–
416. Retrieved from:
http://www.kyb.mpg.de/fileadmin/user_upload/files/publications/attachments/Luxburg07_tutorial_4488%5b0%5d.pdf