Predicting Dartmouth's Hourly Energy Usage
Authors: Tev'n Powers and Henry Stewart
Milestone Write-up May 08, 2012
Overview of Project
Our goal is to use data gathered by Dartmouth College's Neukom Institute, GreenLite Project to predict a dormitory's daily energy consumption (measured in kWh). Knowing this information could be useful to the Dartmouth Power Plant (Facilities Operations & Management) in offsetting fuel costs or finding ways to reduce utility costs.
Changes from proposed method:
At the time of our initial proposal were did not fully understand the use of Support Vector Machines (SVM) for classification and regression tasks. We did not specify in which way we would be using SVM in our prediction model. At this point we have implemented an L1-Norm Non-Linear SV Regression with a bias term. This method was proposed by K.P. Soman in his book "Machine Learning WIth SVM And Other Kernel Methods" as a straight forward SVR implementation. We mention later future changes that we will make before finalizing the model.
Milestone Goals
The goals that we set out to achieve by our Milestone presentation are as follows:
- April 17 - gather 15 minute kW data into a txt file from database
- April 30 - program regression model & classify break day vs non-break day (weekday vs weekend)
- May 1 - 6 - compare daily data with model's predictions
Since our proposal, we have achieved some of these goals and we are behind on some of them as well. We realized that there were limits on the queries and time spans of queries for data from the GreenLite database: data by the Minute (up to 24 hours), Hourly data (up to two weeks per query), and Daily data (up to 180 days). Based off of these limitations we decided that hourly data over a longer period of time would be more essential for predication than data by the minute for a small time span. The following features were extracted from the database: Energy (kWh), Power (kW), Temperature (deg. F), annualized cost ($). A column for holidays was added to the input vector (binary). We then wrote a Python script to organize and format our data from a comma separated value (CVS) file to a Matlab matrix. Using this data, as mentioned above we have programmed an initial version of our SVR but have not finalized the model. The initial results of this trained model are displayed in the Results section below. Later we will also discuss the methods we will use to choose in order to select our final method.
Unfortunately since we have not finalized our model, we did not reach our milestone goal of testing the daily predictions of the model against the true values of Energy consumption for the campus dorms. So we are behind schedule in that aspect, but hope to be there soon.
Results
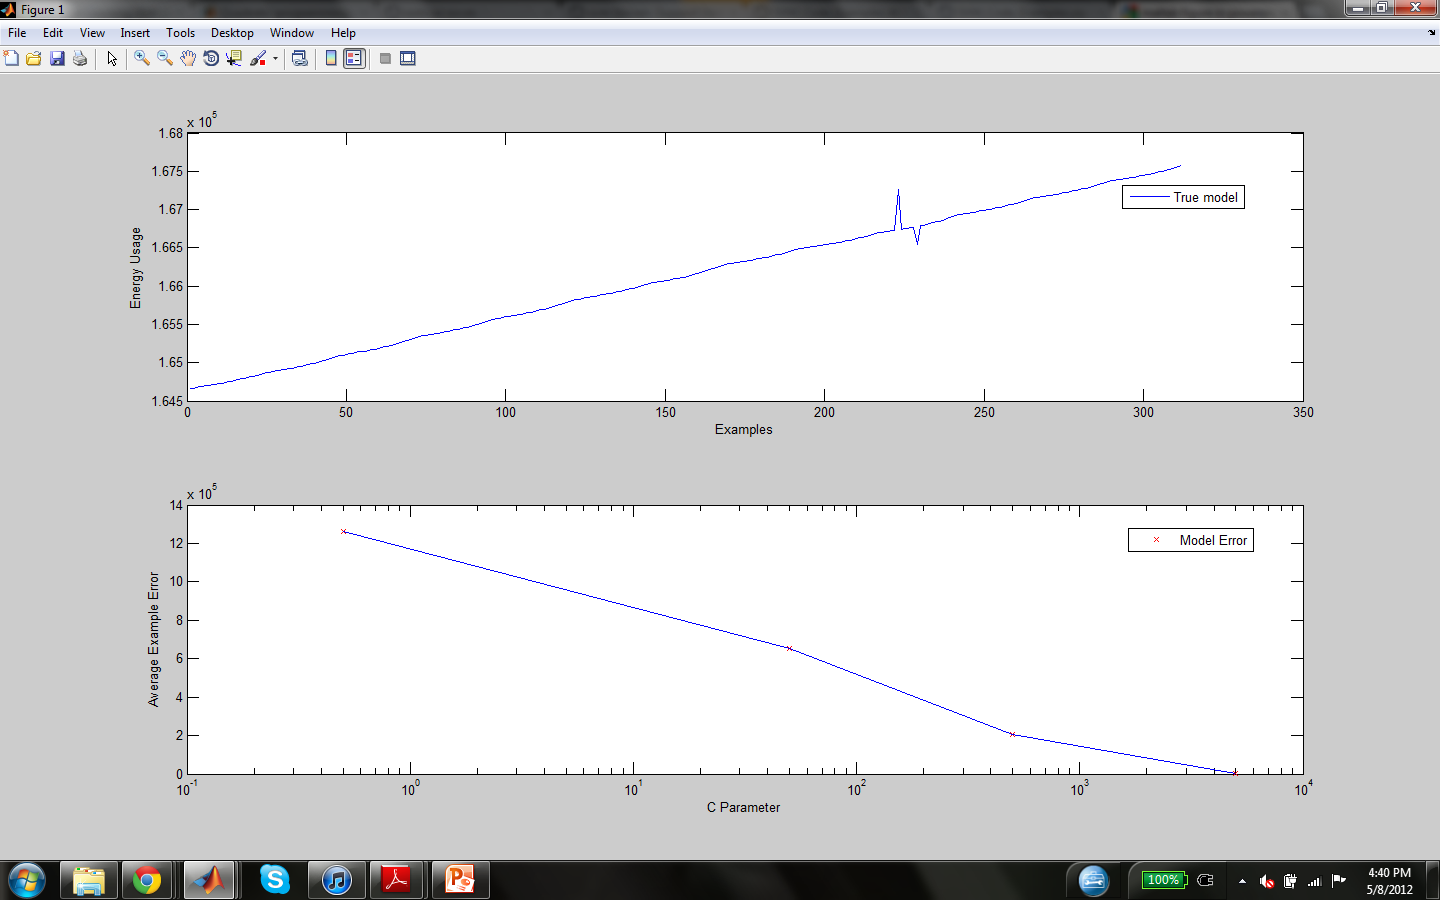
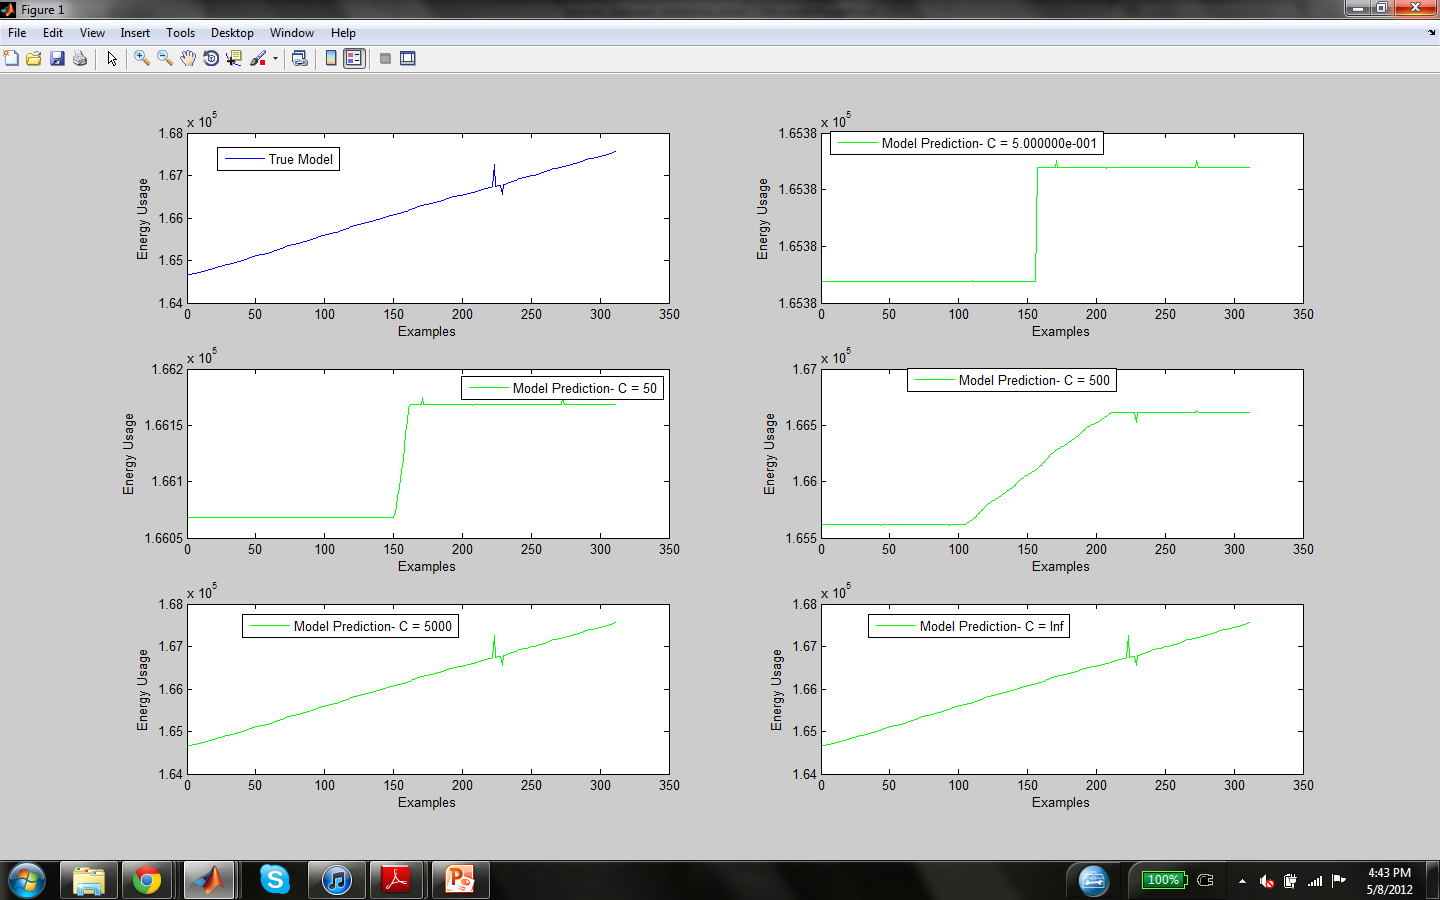
The parameter C in the model objective determines the trade off between training errors and rigid margins. The images below display the mean squared error and function estimation by the model with a variety of C values (C = 0.5, 50, 500, 5000, Inf). Since C dictates the soft margin of the function, as C increases the cost of estimation errors does as well, therefore causing a seemingly more accurate model which might not generalize well to other inputs because of over fitting the training data.
The first graph is the mean squared error of each C value against the training data.
The second graph plots the estimation of the model for the training data against the true value of the training examples (which are plotted at the top left subplot).
//TODO
1. Hyperparameter Selection: We will use cross fold validation technique to see the results of models with various hyperparameters (C, sigma for Gaussian Kernel, Epsilon, and any others from other kernels, etc.). Based on the mean squared test error for these functions, we will decide which values and kernels to use for our final model. Currently we test various C values and use a Gaussian Kernel with sigma value 0.5 and Epsilon value 0.5.
2. Sequential Minimization Optimization: At the moment our algorithm uses the built in quadprog function for solving quadratic programs in order to minimize our objective. We realize that this is not the best method for minimizing the objective and will implement an SMO algorithm to do so.
3. Feature Selection Algorithm: Lastly, we plan to explore the use of feature selection methods mentioned in the article "Feature Selection for Support Vector Regression in the Application of Building Energy Prediction" by Zhao and Magoules to determine which available features will be most useful for our algorithm to learn.
References
http://dev.greenlite.cs.dartmouth.edu
Lecture on linear regression by Lorenzo Torresani
Interview with Tim Tregubov
Interview with Laurie Loeb
Meeting with Weifu Wang
http://alex.smola.org/papers/2003/SmoSch03b.pdf
http://www.ics.uci.edu/~welling/teaching/KernelsICS273B/SVregression.pdf
http://bsrc.kaist.ac.kr/nip-lr/V11N10/V11N10P1-203-224.pdf
http://users.ecs.soton.ac.uk/srg/publications/pdf/SVM.pdf
Machine Learning With Svm And Other Kernel Methods by Soman