Predicting Stocks Based on Twitter Sentiment
Robert Denz
Introduction
My goal is to predict stock prices based off of current twitter sentiment. In order to do this, I initially needed to obtain sentiment information from tweets and historical financial data. From there, I can use this data in a support vector regression machine to make predictions on future stock prices.
Progress
The amount of unprocessed twitter data used for this was in the order of gigabytes. Additionally, the raw data was broken up into monthly increments, though I needed the data to be in day increments. Thus, to resolve this issue, I wrote a python script that parsed the data out into day increments and removed any information I deemed irrelevant. Irrelevant data consisted of information pertaining to users, time, and any tweet not expressing sentiment. Tweets that were deemed relevant contained the sentiment words or phrases "I'm", "Im", "Makes me", or "feel". After running the python script, I now had text files for each day that only contained tweets I wanted to analyze for sentiment.
The first method of extracting sentiment from the tweets I tried was a word list provided by Alex Davies[4]. This method, however, did not return favorable results. Specifically, each day was consistently classified as 86% happy and 14% sad. Therefore, I turned to a simpler method of counting the number of occurrences of key sentiment words after sentiment phrases. These words were "happy", "sad", "good", and "bad". For example, any tweet that contained the phrase "makes me happy" was counted once toward happy. To accomplish this quickly, I wrote a bash script that tallies the total number of occurrences for each word. Then, I simply divided the number of occurrences for each word by the total number of occurrences of all of the words.
Now that I had a simple tally of sentiment for each day, I required stock market data. I gathered historical data on the Dow Jones Industrial Average from Yahoo Financial. Next, I manually parsed this data down to solely date and market close price.
With all of my data gathered, I then implemented a support vector regression machine based on the ε-Insensitive Loss Function[2]. However, the support vector regression machine alone was not enough to produce meaningful data. Therefore, I implemented a Gaussian kernel to be used along with my support vector regression code:
![]()
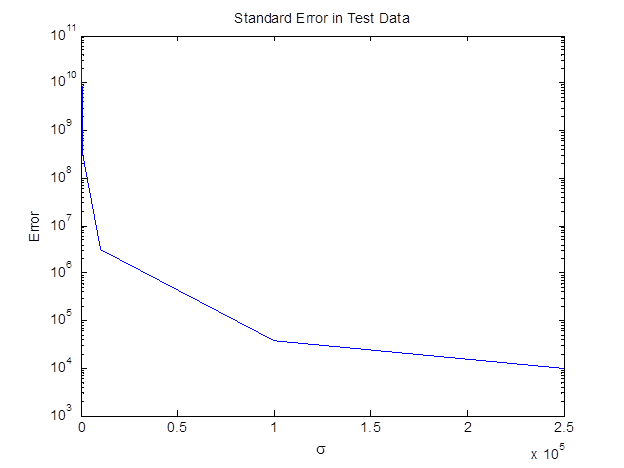
I then tested my Gaussian kernel at different values of σ. The σ that returned the least error on the training set was then used on the test data to make stock market predictions. These results can be seen in the preliminary results section below.
I have kept to the timeline that I have set for myself for this project. I now must further refine my support vector regression code and gathered data to obtain more accurate results.
Preliminary Results
The first graph below shows the error I calculated for each value of sigma on the test set.
Taking the sigma that returns the least error, I then made a prediction on my test data. The graph of the prediction versus actual Dow Jones Industrial Average prices is below.
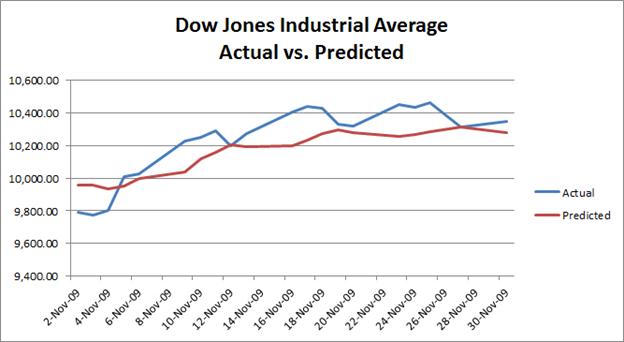
From the graph above, it can be seen that while my function does come close to predicting Dow Jones Industrial Average prices, it does not mirror it as closely as I would expect. I hope to improve my predictions by the time of the final report by improving my support vector regression code and refining my data.
Timeline
4/12 - 4/19 Process twitter and stock data
4/19 - 5/1 Develop support vector regression code
5/1 - 5/5 Begin testing
5/5 - 5/8 Project milestone report
5/9 - 5/22 Optimize datasets and support vector regression code
5/22 - 5/29 Final Report: Document the methodology and results
References
1. W. Lee, C. Jiang, and D. Indro. Stock Market Volatility, Excess Returns, and the Role of Investor Sentiment. In the Journal of Banking & Finance Volume 26, Issue 12, 2002, Pages 2277-2299.
2. H. Drucker, C. Burges, L. Kaufman, A. Smola, and V. Vapnik Support Vector Regression Machines. In Advances in Neural Information Processing Systems 9, NIPS 1996, 155-161, MIT Press.
3. J. Yang, J. Leskovec. Temporal Variation in Online Media. In ACM International Conference on Web Search and Data Mining (WSDM '11), 2011.
4. A Davies A word list for sentiment analysis of twitter. http://alexdavies.net/2011/10/word-lists-for-sentiment-analysis-of-twitter/, Oct. 2011