Inferring Personality from Mobile Phone Behavioral Data
Fanglin Chen, Jianfu Zhou
Department of Computer Science
Dartmouth College {fanglin.chen.gr, jianfu.zhou.gr}@dartmouth.edu
1 Review
Nowadays, there have been many research papers focusing on using text data to infer human personality [1,2,3]. However, the associations between word categories and personality are relatively weak [1]. To infer personality more accurately, we need to utilize information more than those simple linguistic markers. Massive data from our pervasive smartphones give us this opportunity.
In our project, we focus on inferring human personality, especially five core traits (known as Big Five Personality Traits [4]), by means of looking into the daily mobile phone behavioral data (e.g. social interaction, calling behavior) [5], hoping that we could find out the correlation between mobile phone behavioral data and personality categorization.
In our project, we will use the MIT Friend and Family dataset [6]. This dataset consists of two parts: the sensor data and the survey data, which together show the social structure of a young family residential living community. To be specific, (a) the sensor data shows the proximity to other people and records of phone calls and text messages (SMS), and (b) the survey data shows the relations with other participants in the community before the test, social interactions and the personality indicators. 53 participants took the Big Five Personality Test [7]. In the dataset, each person's personality in this group of people has been labelled.
2 Methodology
2.1 Preprocessing
The bluetooth data measures the physical co-location behavior in a person's daily life. If there is a bluetooth mobile device entering a user's radiation range, then a co-location behavior is monitored. To eliminate random occurrence of co-location behavior, we don't take into account the co-location behavior which has relative low-frequency occurrence.
The text messages and voice calls measure the communicational behaviour of a person in everyday life. If there are text messages or voice calls between two people, that means they are in each other's contacts.
Before calculating the features, we carried out Laplace smoothing on the dataset. We scale all the features to improve the convergence rates and reduce the influence of different ranges of feature value. From the dataset we get the questionnaire
answers of "The Big Five Inventory" [7], then get the 100-point scale scores of each personality dimension. We simplify the personality score into binary class. When the score is higher 50, we regard it as the first class. For the score which is lower than 50, we regard it as the second class.
2.2 Features
Entropy: Is a quantitative measure reflecting how many different categories there are in a given random variable, and simultaneously takes into account how evenly the basic units are distributed among those categories. For example, the entropy of one's contacts is the ratio between one's total number of contacts and the relative frequency at which one interacts with them.
H(a − c)
=
−
∑ c
fc logfc
fc
=
# of a communicates with c
total # of a′s contacts
where c is a contact and fc the frequency at which a communicates with c. The more one interacts equally often with a large number of contacts the higher the entropy will be. Our project considers the entropy of bluetooth, calls and text [8].
Inter-event time: Is the time elapsed between two events. Our project then consider both the average and variance of the inter-event time of one's call and text.
Response rate and latency (text): We consider a text from a user (A) to be a response to a text received from another user (B) if it is sent within an hour after user A received the last text from user B. The response rate is the percentage of texts people respond to. The latency is the median time it takes people to answer a text. Note than by definition, latency will be less or equal to one hour [8].
Number of contacts: Is a quantitative measure reflecting how many persons there are one communicates with. Our project considers the contacts from the bluetooth, call and text.
Percentage of call during night: Is a quantitative measure reflecting how many calls there are made during the night. In our project, we set the night to be 6pm to 6am.
p =
# of calls one made during night
total # of one′s calls
Percentage of initiated contacts: Is the ratio between the number of contacts one initiated and one's total number of contacts. Our project then consider the percentage of initiated call and text.
p =
# of contacts one initiated
total # of one′s contacts
We have totally 12 features in our feature set: Entropy (Bluetooth, Message, Call), Inter-event time (Message, Call), Response rate and latency (Message), Number of Contacts (Bluetooth, Message, Call), Percentage of call during night, Percentage of initiated contacts (Message, Call).
2.3 Models
In the proposal, we proposed to use random forest and support vector machine because they were recommended in our literature review. Since we are implementing both of these approaches in class, we needed to choose a different classifier. We decided to start with SVM to get the preliminary results and move on to Gradient Boosted Decision Tree.
2.3.1 SVM
The relationship between personality traits and numerous behavioral and psychological factors are really not linear [9]. So we decide to start with SVM with RBF kernel to build model.
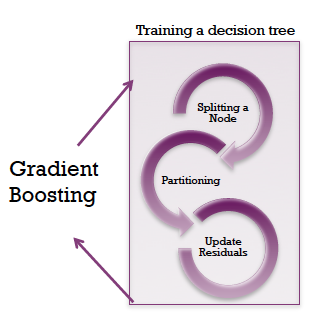
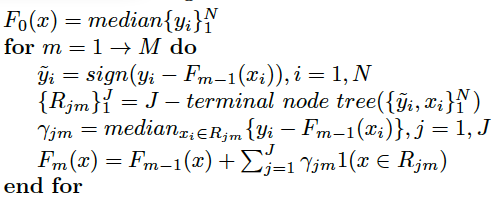
2.3.2 Gradient Boosted Decision Tree
GBDT is a machine learning algorithm that iteratively constructs an ensemble of weak decision tree learners through boosting. The pipeline of this algorithm can be shown in Figure 1, and the pseudocode is shown in Figure 2. Basically we incorporate regression tree into the framework of Gradient Boosting.
The prediction accuracy over the test set and the cross validation set is shown in Figure 3 and 4. As shown in the figure, we can find that the prediction of openness, conscientiousness and extroversion can be better predicted than agreeableness and neuroticism. To some extent this makes sense because agreeableness and neuroticism are more delicate than the traits like extroversion. People who shows a strong tendency to extroversion may seek stimulation in the company of others, and they are more likely to be outgoing and energetic. This behavioral pattern can be correlated with their phone usage level.
Figure 4:
The average 5 fold cross-validation accuracy.
2.5 Feature Selection
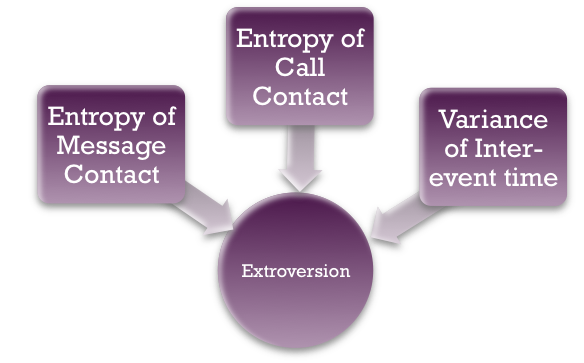
An investigation of the most important feature to predict each trait revealed interesting associations. For example, the entropy of participants' contacts helped predict Extroversion. These findings are inline with past research showing these traits both relate to different aspects of the diversity of one's social network: extraverts tend to seek more friends than introverts, agreeable individuals tend to be selected more as friends by other people.
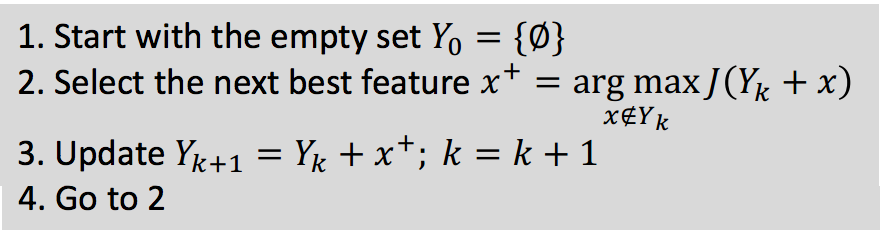
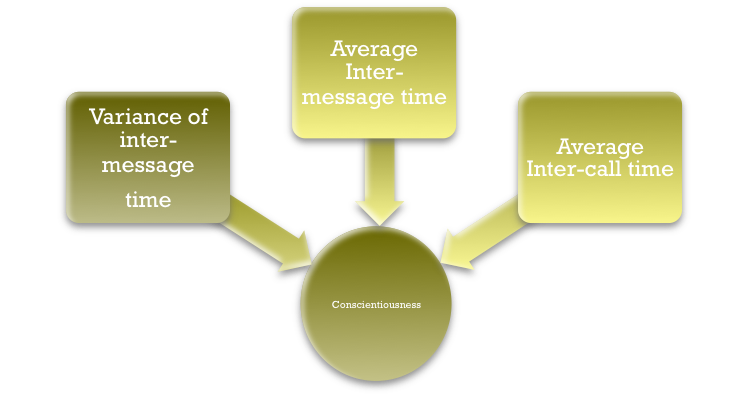
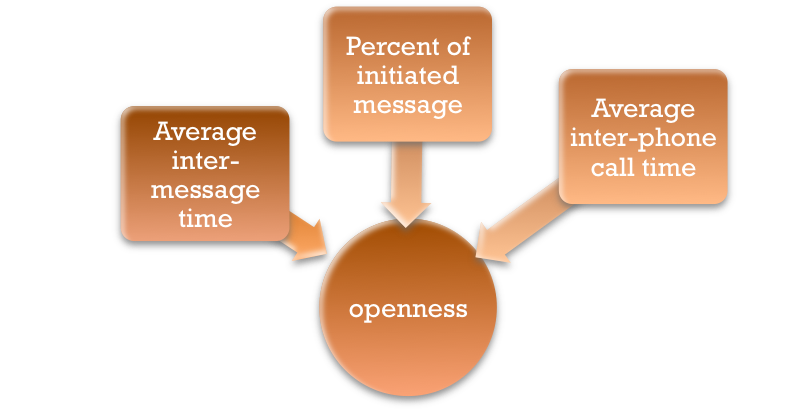
We use sequential forward selection (SFS) algorithm to find the approximate best indicators in the feature set. The algorithm starts with one-feature model to get the feature which returns the highest accuracy and then iterates to get the second feature in the same way. The pseudocode is shown in the Figure 5. An example process of algorithm convergence is shown in the Figure 6. We have found the top-3 indicators in the feature set for different personality dimensions (shown in Figure 7, Figure 8, and Figure 9).
Figure 9:
The average inter-message time, percent of initiated message, and the average inter-call time are the top 3 indicators in the feature set.
3 What's Next
We will complete the implementation of Gradient-Boosted Decision Tree to deal with the 100-point scale score of personality dimension. Unlike the SVM that we used to do binary classification, we plan to use GBDT. We want to see the prediction performance if we regard this as a regression problem.
L. Qiu, H. Lin, J. Ramsay, and F. Yang, "You are what you tweet: Personality
expression and perception on twitter," Journal of Research in
Personality, 2012.
F. Mairesse, Learning to Adapt in Dialogue Systems: Data-driven Models for
Personality Recognition and Generation.
PhD thesis, University of Sheffield, United Kingdom, 2008.
D. Quercia, R. Lambiotte, M. Kosinski, D. Stillwell, and J. Crowcroft, "The
personality of popular facebook users," in Proceedings of the ACM 2012
conference on Computer Supported Cooperative Work (CSCW'12), 2012.
S. Gosling, P. Rentfrow, and W. Swann, "A very brief measure of the big-five
personality domains," Journal of Research in personality, vol. 37,
no. 6, pp. 504-528, 2003.
N. Lane, E. Miluzzo, H. Lu, D. Peebles, T. Choudhury, and A. Campbell, "A
survey of mobile phone sensing," Communications Magazine, IEEE,
vol. 48, no. 9, pp. 140-150, 2010.
N. Aharony, W. Pan, C. Ip, I. Khayal, and A. Pentland, "Social fmri:
Investigating and shaping social mechanisms in the real world,"
Pervasive Mob. Comput., vol. 7, pp. 643-659, Dec. 2011.
M. J. Benson and J. P. Campbell, "To be, or not to be, linear: An expanded
representation of personality and its relationship to leadership
performance," International Journal of Selection and Assessment,
vol. 15, no. 2, pp. 232-249, 2007.