Chemistry Reaction among NBA Players
Xianan Hao,
Ruixuan Hou, Weijia Mao
COSC 174 - Machine Learning and Statistical Data
Winter 2013
1 Problem Introduction
How to choose best five best players to
win the game? This interesting problem is essentially finding an optimal subset
of items that maximize the utility defined over multiple items. There exist two methods to solve optimal subset issues. The first
one is assuming a completely known preference function, given preference
function parameters, the parameters can be learned from historical data. However,
to our knowledge, it’s hard to define and parameterize the preference function
for NBA player problem. The second one is without assuming preference function,
maximizing the set similarity of selected set and labeled optimal subset. We use second method.
2 Dataset
We are using data downloaded from
BasketballValue.com, which provides data for advanced statistical analysis of
the NBA[1]. Our data set
contains two part: one is feature vectors that describe each player and the
other is statistical analysis of each combination of players.
In the first part of our data set, each player has a 31
dimensional vector that describe his performance and efficiency on/off
court. Unlike some intuitive stats provided by ESPN NBA[2] which contains points per game, assistance per game,
BasketballValue.com provides more in depth stats that describe the player’s
overall effects on court. For example, it provides a plus-minus stats that
represents the overall points win/lose by the team when the player is on court.
And even the stats of team performance when the player is off court. Also, it
provides not only average performance per unit time but also the average
performance per possession, which is defined as a continuous segment of a
game where one team maintains possession of the ball. In this way, the
stats could be more representative for the player’s efficiency.
One issue to be mentioned is that the player’s vector
contains two kinds of features. One is calculated as the stat per unit time or
per possession, the other is the accumulated stats over the whole season, for
example, the total points get by the player over the whole season. This accumulative
data is affected by the on court time greatly and may not be very
representative for a player’s capability. For example, one good player’s
accumulative stats is low since he is absent for most of games due to injury.
The second part of our data is the stats of each player
combination. One team may have different players on court during different time
slot. Basketballvalue.com provides data of each match up, a log file that keeps
track of during each time slot, which 5 players are on court and the team’s
wining/losing points during that time. We process these logs and get a list of
possible player combinations in each team and their overall
winning/losing points per unit time. This data set enable us to evaluate the
performance of player sets and make comparison.
3 Model and Methods
Choosing 5 players that cooperate to provide the best performance is a problem o f choosing the optimal subset of a ground set. We implemented algorithm[3] to choose the optimal subset of a team of players as the predicted best 5 of this team.
3.1 Current model
By milestone, we use the following model as the score of 5-player combination performance:
![]()
where ![]() is the ground set of the players in a particular
team,
is the ground set of the players in a particular
team, ![]() is the predicted optimal subset and
is the predicted optimal subset and ![]() is the weight vector for each player
vector in
is the weight vector for each player
vector in ![]() .
.
![]() is a feature map jointly defined by a
ground set and a candidate subset as follows:
is a feature map jointly defined by a
ground set and a candidate subset as follows:
![]()
where
![]() is a real valued vector in
is a real valued vector in ![]() representing the feature vector for each
player. This feature map, combined with the model above, means that we add
representing the feature vector for each
player. This feature map, combined with the model above, means that we add ![]() to the performance score when
to the performance score when ![]() is selected in
is selected in ![]() ,
otherwise, we subtract
,
otherwise, we subtract ![]() from the performance score.
from the performance score.
Then
the main problem is to solve ![]() .
.
3.2
Optimization problem
We learned that this problem is a structured learning problem and can be solved using structural SVM[5]. The following is the formulation:
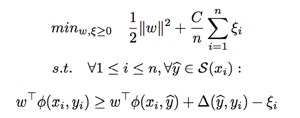
where ![]() is the predicted subset and
is the predicted subset and ![]() is the loss function defined by:
is the loss function defined by:
![]()
This loss function captures the difference between the predicted subset and labeled true optimal subset.
3.3 Prediction
Once
the weight vector ![]() is optimized , we
compute the performance score for each possible combination and choose the one
with the highest score as our predicted optimal subset:
is optimized , we
compute the performance score for each possible combination and choose the one
with the highest score as our predicted optimal subset:
![]()
4 Results
We used the data of NBA 2010 – 2011 season as a test for our method. We randomly set 20 teams as the training set and the remaining 10 teams as the test set. We tried a few rounds and the following is one of the results that we obtained most frequently.
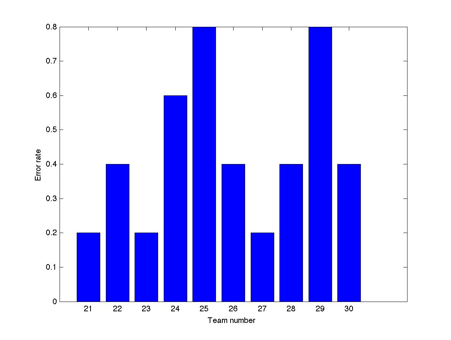
The error rate is defined as the portion of players that are mistakenly predicted as members of the optimal subset compared to the labeled best 5. We can see that for 3 teams, we hit 4 positive true best players and for 4 teams, we hit 3 best players. However, we also obtained some unacceptable results. For one team, we hit 2 best players and for two teams, we only hit 1 best player.
5 Results Analysis
We think there are several reasons that cause our method to fail on some teams.
The first is that we have used the data of only one season, and there are 30 teams altogether in NBA, so the training data we used is not large enough. This problem is quite easy to overcome since we just need to add the data of other seasons to our current data. One thing we should be careful about is that there are players exchange among teams every year and that causes the difference in labeled optimal players.
The second is that we discovered some of the features that we obtained from the Internet do not provide useful information on how to predict the best 5 players. We might need to look into that and trim our data.
There might also be problems for the model we are currently using and we need to look into that, too.
6 Future Work
One very important issue is that the result so far is obtained by enumerating all possible combinations for training and testing. Enumerating is only possible because our problem is 10 choose 5, i.e. 252 possibilities for each team. We want to solve this problem by implementing the cutting plane algorithm proposed in [5].
The second major issue is that we haven’t really used the model in our proposal. We want to try to use that model and hope we can get better results.
References
[1] http://basketballvalue.com/downloads.php
[2] http://espn.go.com/nba/statistics
[3] Y Guo, C Gomes, Learning Optimal Subsets with Implicit User Preferences, Proceedings of the 21st International Joint Conference , 2009
[4] Brian McFee, Gert Lanckriet, Metric Learning to Rank, International Conference on Machine Learning,2010
[5] I. Tsochantaridis, T. Joachims, T. Hofmann, and Y. Altun. Large margin methods for structured and interdependent output variables.