Flocking behavior of US equities
Ira Ray Jenkins and Tim Pierson
Dartmouth College Department of Computer Science
{jenkins, tjp}@cs.dartmouth.edu
Project Overview
We plan to use concepts developed in academic studies of the flocking behavior of some kinds of animals (e.g., flocks of birds or schools of fish) as a basis for predicting equity price movements in US stock markets. Our hypothesis is that groups of related companies, such as industry sectors (e.g., Industrials, Technology, Energy, Consumer Durables) can be modeled as a flock of animals with the individual companies within a sector representing individual animals within a flock.
Modeling the behavior of flocks of animals
Accurately modeling the collective behavior of large groups of animals has historically been difficult [2]. Early attempts to model flock behavior with computer generated "boids", however, uncovered three basic rules for each individual in a flock that can produce realistic computer simulations of flocking animals [6]. These rules are:
- Collision Avoidance. Avoid collisions with nearby flock mates.
- Velocity Matching. Attempt to match velocity with nearby flock mates.
- Flock Centering. Attempt to stay close to nearby flock mates. (Animals outside the flock tend to get eaten.)
More recent studies of animal flocking have built upon these rules, refining the concept of Collision Avoidance into the concept of a Zone of Repulsion around each animal, Velocity Matching into a Zone of Orientation, and Flock Centering into a Zone of Attraction [3]. See Figure 1 for more details.
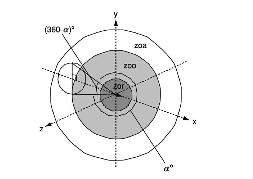
Figure 1.
A representation of an individual in three-dimensional space, centered at the origin and pointing in the direction of travel. The area labeled zor shows the Zone of Repulsion where individuals try to avoid collisions. The area labeled zoo represents the Zone of Orientation where individuals try to align their direction of travel with neighboring individuals. The area labeled zoa is the Zone of Attraction where individuals attempt to stay close to others in the flock. A possible "blind volume" behind each individual is also shown. An individual's field of perception is indicated by α. (From Couzin, 2003)An animal's position relative to other animals in each Zone provides clues as to what action an individual will take. For instance, in a flock of birds, if a neighboring bird enters into the Zone of Repulsion of Bird A, perhaps because it was caught by a gust of wind, then Bird A will maneuver away from that neighbor to avoid a collision. This in turn may effect Bird A's other neighbors, causing animals on Bird A's left to maneuver left. Continuing on, birds in the Zone of Attraction will attempt to stay close to the maneuvering birds, and may also move left. This maneuvering may cause the entire flock to make a change of direction that was originally based on the action of a single bird trying to avoid a collision.
These rules work well if we imagine a predator approaching a flock. Individuals on the perimeter of the flock may notice the predator and maneuver away from the threat. This causes the birds near the outside of the flock to maneuver away from the birds reacting to the predator (in this case to avoid collision). This reaction quickly ripples through the entire flock and results in the entire flock moving away from the predator almost instantaneously. Interestingly, this action is intelligent for the flock, but happens without a leader directing the individuals and with each individual having only local knowledge of the environment (e.g., individuals do not have knowledge of the location and actions of every individual in the entire flock). Our suspicion is that equities do something similar. There is no leader directing the movement of individual equities in the stock market and the market tends to react quickly to events such as breaking news.
Modeling the equities markets as a flock
In the past it was considered impossible to predict direction changes in a flock of real animals, but Bialek has recently reported good success [1]. Similarly many consider it impossible to accurately predict changes in prices of equities in the stock market [5]. We hope we will be able to use the principles others have used to predict the movement of flocks of animals to accurately predict the movement of equity prices in the stock market.
In our case, we will use individual stocks to simulate individual animals and will use industry sectors to simulate flocks (e.g., the individual company Apple belongs to the Technology sector or flock). During the course of the term we will develop metrics to simulate an individual's position within the flock. For instance, we may model the percentage change of a stock's current price vs. the closing price of the previous trading day. When we look at all stocks within an industry sector, we'd expect to see some stocks up in price, some down in price, and some relatively unchanged. This then gives us an indication of each stock's position within the flock. The direction each individual animal is facing may be simulated by the recent price changes of each equity (e.g., the price over the last n minutes has been going up, so the individual is facing upward, or the price has been going down, so the individual is facing downward). The velocity of each individual may be modeled by recent volume of trading activity.
Our hypothesis is that there are times in the market where prices are changing in a predictable fashion, akin to a flock of animals moving predictably away from a predator. The cause for united movement of the flock in the equities markets may be due to a number of factors including breaking news that affects the entire market, specific sectors or just specific stocks. We hope, for instance, that the metrics we develop will allow us to determine that a particular stock or sector is moving, then accurately predict the movements of other stocks in response. This is similar to how biologists are trying to predict the movements of individuals animals based on movements of nearby animals in the same flock.
We also expect that there will be times when the markets exhibit behavior described by the well–known Random Walk Theory [4]. In these cases, the stock market is not moving predictably in any particular direction. Instead the market is floating up and down, with prices of each equity changing by small amounts in a relatively random fashion. This behavior, we hope to find, is similar to a flock of animals milling about, with each individual animal moving in random directions, but staying close to the center of the flock. We hope the metrics we develop will help us identify these times when price changes are moving randomly and unpredictably.
We realize that modeling stocks within a sector is not exactly like modeling individual animals within a flock. We suspect, for instance, that there is no Zone of Repulsion for in the equities markets. Real animals cannot occupy the same space at the same time and try to avoid collisions. Stocks, however, can have the same price. To be clear, we are inspired by the work of biologists on flocking behavior of real animals and hope to use it as a starting point to learn more about the behavior of equity markets.
Challenges
Equities markets are notoriously difficult to predict. In fact, the famous Efficient Market Hypothesis (EMH) suggests that it is impossible to predict the direction of equities markets because the market price of each individual equity already accounts for all known information. Furthermore, the EMH states that prices change instantly to reflect new information [5]. If the EMH turns out to be perfectly accurate, then our approach may yield no tangible results. There is, however, a good deal of evidence to suggest the EMH is not completely accurate [7].
Methods
During the course of the term we will develop metrics to simulate the position of each individual equity's position within the flock. Currently we intend to use intra–day stock prices taken at one minute intervals to develop these metrics. One minute intervals will give us the open, high, low and close prices for each equity for each minute of the trading day. We may also use the number of shares traded during each trading minute. These metrics will form the feature set of our model. We expect to experiment to identify features that provide useful information for making predictions.
We will develop target values for each feature set by looking at the change in a stock's price over a period of m minutes. We will likely represent this as a real value of the percentage change in price from the closing price of minute t to the closing price of minute t + m where t and t + m are in the same trading day (e.g., don't look forward to the open price the next day when at the end of a trading day). Alternatively, we may choose to represent the target value as an ordinal. In this case we will create categories, say where the stock is up in price by p%, down in price by p%, or unchanged.
If the target values are real values, we have a regression problem. If they are ordinal, we have a classification problem. In either case we intend to feed the feature set and target values into a machine learning algorithm such as a neural network or support vector machine. Our hope is that the resulting model will be able to accurately predict how each equity will move in price in the next m minutes given its position in the flock.
Data
We intend to use historical stock prices in one minute "bars" provided by Track Data, a commercial data vendor. Each bar consists of an open, high, low and close price for each trading minute of the stock. We will also have the number of shares traded during each minute.
Timeline
By the milestone, we anticipate having collected our data, selected a robust feature set, and completed some initial runs with some type of classification and/or regression algorithm. At the milestone, we will reevaluate our feature selection and make any necessary changes to our methods to more accurately model our hypothesis. Given time, we might compare different feature sets and models.
Due Dates:
- Proposal: January 24, 2013
- Milestone: February 19, 2013
- Final: March 7, 2013
References
- William Bialek, Andrea Cavagna, Irene Giardina, Thierry Mora, Edmondo Silvestri, Massimiliano Viale, and Aleksandra M. Walczak. Statistical mechanics for natural flocks of birds. Proceedings of the National Academy of Sciences, 109(13):4786–4791, 2012.
- S. Camazine, J.L. Deneubourg, N.R. Franks, J. Sneyd, G. Theraula, and E. Bonabeau. Self–organization in biological systems. Princeton University Press, 2003.
- Iain D Couzin and Jens Krause. Self–organization and collective behavior in vertebrates. Volume 32 of Advances in the Study of Behavior, pages 1–75. Academic Press, 2003.
- Burton G. Malkiel. A Random Walk Down WallStreet: The Time–Tested Strategy For Successful Investing. Norton, New York, NY, USA, 2003.
- Burton G. Malkiel and Eugene F. Fama. Efficient capital markets: A review of theory and empirical work. The Journal of Finance, 25(2):383–417, 1970.
- Craig W. Reynolds. Flocks, herds and schools: A distributed behavioral model. In Proceedings of the 14th annual conference on Computer graphics and interactive techniques, SIGGRAPH '87, pages 25–34, New York, NY, USA, 1987. ACM.
- J.D. Schwager and J. Greenblatt. Market Sense and Nonsense: How the Markets Really Work (and How They Don't). Wiley, 2012.