# Tools
Android has a number of useful tools that are mostly integrated in to ADT but also can be run from the command line. In this lecture we give a quick overview of the tools and then show how the can be used to graphically look into a UI layout.
The SDK tools are installed with the SDK starter package and are periodically updated. The SDK tools are required if you are developing Android applications. The most important SDK tools include the Android SDK Manager (android sdk), the AVD Manager (android avd) the emulator (emulator), and the Dalvik Debug Monitor Server (ddms).
## What this lecture will teach you
- Tools: workspace/adt-bundle-mac-x86_64/sdk/tools
- SDK and system tools
- HierarchyViewer tool
- Exploring the tree view
- Checkout HierarchyViewer in landscape mode
## Tools: workspace/adt-bundle-mac-x86_64/sdk/tools
There are a number of useful tools in the sdk directory in your workspace under tools. Typically found in:
workspace/adt-bundle-mac-x86_64/sdk/tools
The tools are classified into two groups: SDK tools and platform tools. SDK tools are platform independent and are required no matter which Android platform you are developing on. Platform tools are customized to support the features of the latest Android platform.
~~~{.java}
$ pwd
/Users/atc/teaching/cs65/workspace/adt-bundle-mac-x86_64/sdk/tools
$ ls
Jet emulator-mips monitor
NOTICE.txt emulator-x86 monkeyrunner
adb_has_moved.txt emulator64-arm proguard
android emulator64-mips source.properties
ant emulator64-x86 sqlite3
apkbuilder etc1tool support
apps hierarchyviewer systrace
ddms hprof-conv templates
dmtracedump jobb traceview
draw9patch lib uiautomatorviewer
emulator lint zipalign
emulator-arm mksdcard
$
~~~
## SDK and system tools
The SDK tools are installed with the SDK starter package and are periodically updated. The SDK tools are required if you are developing Android applications. The most important SDK tools include the Android SDK Manager (android sdk), the AVD Manager (android avd) the emulator (emulator), and the Dalvik Debug Monitor Server (ddms). A short summary of some frequently-used SDK tools is provided below.
Many of these tools are directly accessible from ADT or from the command line. See [SDK tools](http://developer.android.com/tools/help/index.html) for a discussion of all the tools:
- *Hierarchy Viewer (hierarchyviewer)*vLets you debug and optimize an Android application's user interface.
- *android* Lets you manage AVDs, projects, and the installed components of the SDK.
- *Dalvik Debug Monitor Server (ddms)* Lets you debug Android applications.
- *dmtracedump* Generates graphical call-stack diagrams from trace log files. The tool uses the Graphviz Dot utility to create the graphical output, so you need to install Graphviz before running dmtracedump.
- *Draw 9-patch* Allows you to easily create a NinePatch graphic using a WYSIWYG editor. It also previews stretched versions of the image, and highlights the area in which content is allowed.
- *Android Emulator (emulator)* A QEMU-based device-emulation tool that you can use to design, debug, and test your applications in an actual Android run-time environment.
- *hprof-conv* Converts the HPROF file that is generated by the Android SDK tools to a standard format so you can view the file in a profiling tool of your choice.
- *layoutopt* Lets you quickly analyze your application's layouts in order to optimize them for efficiency.
- *mksdcard* Helps you create a disk image that you can use with the emulator, to simulate the presence of an external storage card (such as an SD card).
- *Monkey* Runs on your emulator or device and generates pseudo-random streams of user events such as clicks, touches, or gestures, as well as a number of system-level events. You can use the Monkey to stress-test applications that you are developing, in a random yet repeatable manner.
- *monkeyrunner* Provides an API for writing programs that control an Android device or emulator from outside of Android code.
- *ProGuard* Shrinks, optimizes, and obfuscates your code by removing unused code and renaming classes, fields, and methods with semantically obscure names.
- *Systrace* Lets you analyze the execution of your application in the context of system processes, to help diagnose display and performance issues.
- *sqlite3* Lets you access the SQLite data files created and used by Android applications.
- *traceview* Provides a graphical viewer for execution logs saved by your application.
- *zipalign* Optimizes .apk files by ensuring that all uncompressed data starts with a particular alignment relative to the start of the file. This should always be used to align .apk files after they have been signed.
Most students learning Android for the first time will not use these tools directly -- probably will implicitly through the IDE. But as you gain experience or come across a tricky debug problem then you may start to use one or more of them. You directly use only one of the platform tools—the Android Debug Bridge (adb). Android Debug Bridge is a versatile tool that lets you manage the state of an emulator instance or Android-powered device. You can also use it to install an Android application (.apk) file on a device.
We are going to take hierarchyviewer for a spin to study and visualize the layouts for the fragment app for portrait and landscape.
## HierarchyViewer tool
HierarchyViewer is an Android SDK tool that can be used to inspect and debug the user interface of running applications. Assume we want to see our UI layout running, study its view tree, perhaps work on its performance -- layout, parent/children views -- various rendering and drawing times. Then there is a nifty tool that allows us to profile the UI performance called *hierarchyviewer*. You'll see it in the directory above.
This tool is good for debugging and exploring the relationships in a layout of the parent and child views which are for the most part hierarchical - for example in the case of our layout 8 text views inside a listview.
In the demo below we use hierarchyviewer with the emulator (not the phone). You can use this with the phone but have to install [ViewServer](https://github.com/romainguy/ViewServer). For now we'll use the emulator for the discuss below.
To get going start the Fragment app in the emulator and open a terminal go to the directory the tools are located in e.g., workspace/adt-bundle-mac-x86_64/sdk/tools, and type `./hierarchyviewer` in a terminal at the command line -- make sure you are in the correct directory.
The listview and the actionbar container inside linearlayout (which is the root layout, and can you can get a reference to that id using android.R.id.content -- content is root -- in your code is you wish, we will use this later), as shown below.
Note that `android.R.id.content` used in the fragmemt code gives you the root element of a view, without having to know its actual name/type/ID. You can see the *content* in the HierarchyViewer.
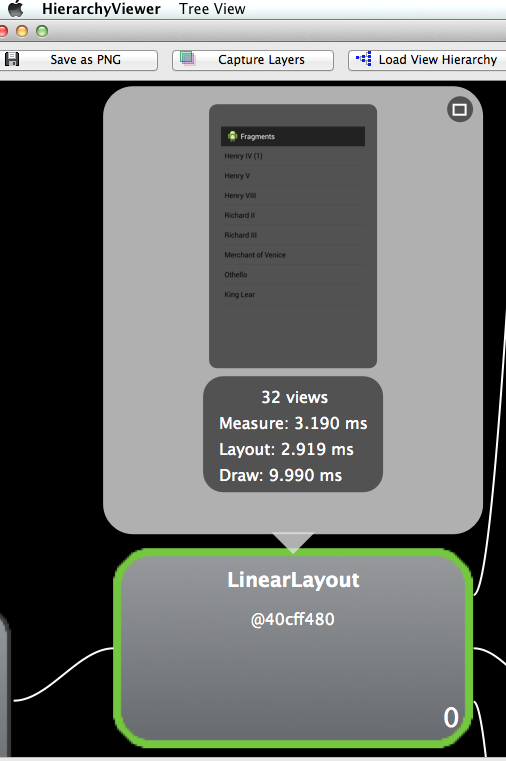
In the portion of the layout tree above you see the complete UI with the embedded child views. How cool is that.
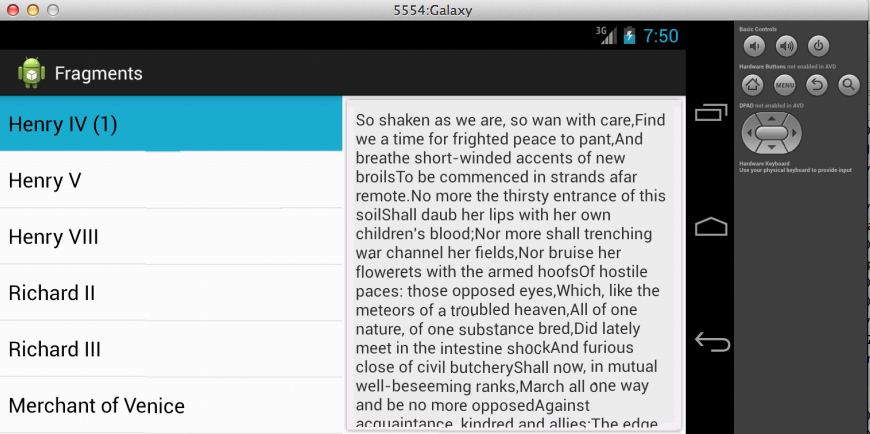
Once you start up the emulator and the program runs you see the app in portrait mode, as shown below. Recall the fragment app resizes itself if the user flips to landscape.
[](images/shv7.png)
The UI for landscape is defined in res/layouts/fragment_layout.xml, as shown below.
~~~{.java}
~~~
## Exploring the tree view
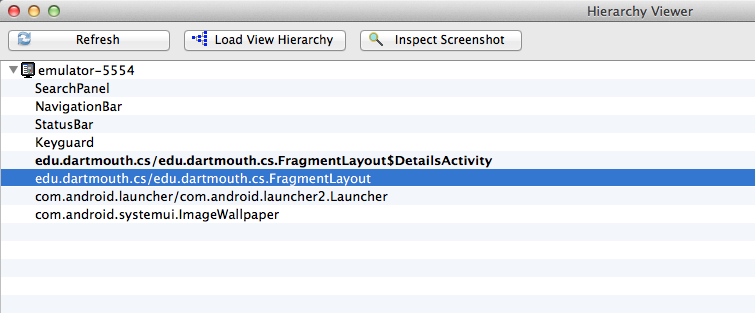
When the HierarchyViewer starts you will see the following screen.
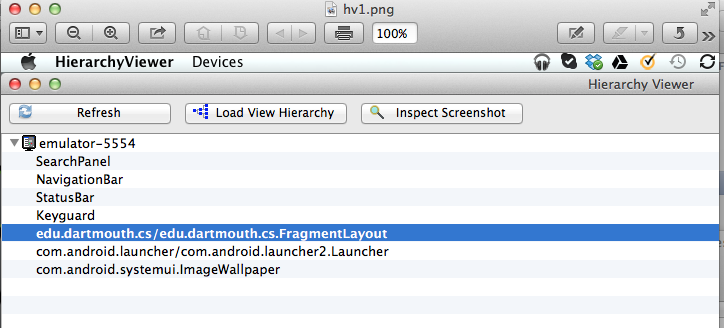
This shows all the activities running. Click on the fragments to switch to the tree view. You know see -- what looks like a complicated -- a tree of all your views -- parent and child. The key thing to note is that the complete layout includes the icon in the action bar and the associated text of the application name: fragments. The lower part of the tree is associated with the list of titles we want to render, as shown below
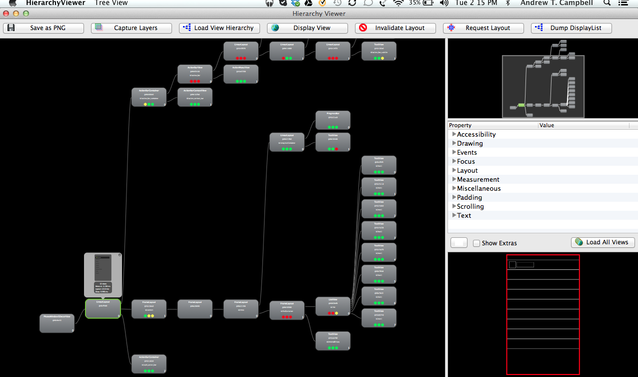
You can do some very cool things with this app and it’s quite the teaching tool in seeing how views are laid out and the parent/child relationships. I can't cover all the details here so the best thing is to load the hierarchyviewer and just explore it you. Here is a cool feature. On the bottom right you can highlight a part of the UI and its sub tree is automatically highlighted. You can also look at the properties -- layout, drawing, events, padding, and text -- associated with a view.
For more information of how hierarchyviewer works watch this [short video tutorial](http://www.youtube.com/watch?v=PAgE7saQUUY) - the dude sounds like the name of the phone.
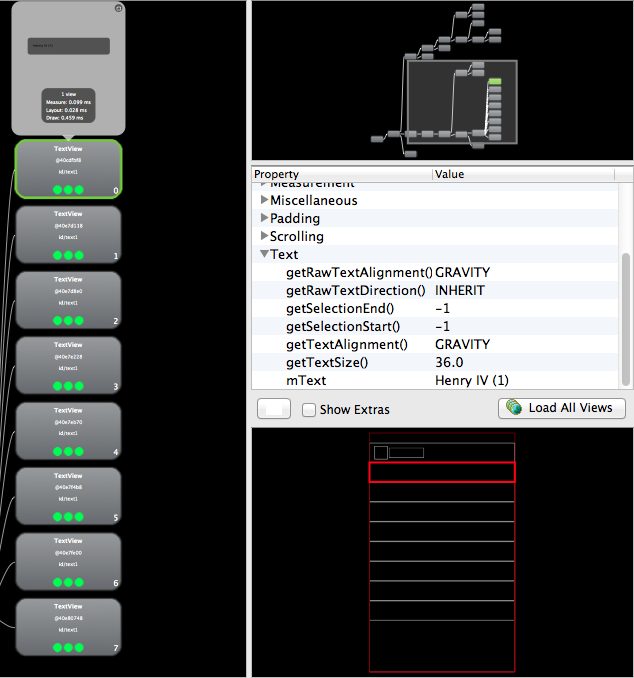
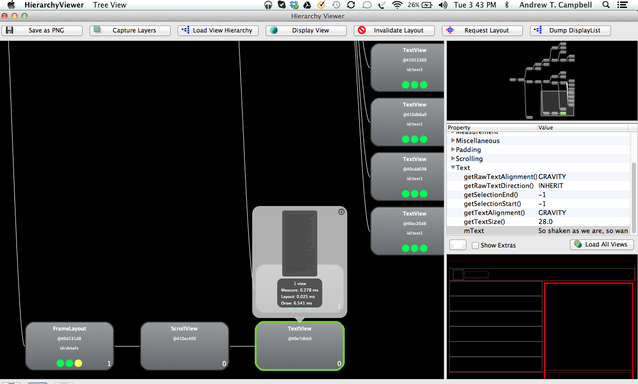
I have highlighted (that is to say clicked on) Henry IV (1) on the view in the bottom left pane. You see a red box around text in the listview (well really ListFragment). The lighter red box (harder to see in these notes) around the text is the parent view -- the framelayout view. You can also see under properties the name of the text field: Henry IV (1).
## Checkout HierarchyViewer in landscape mode
Because the fragmemt app loads a different res/layout-land/fragment_layout.html when the user flips the screen from portrait to landscape we can use the hierarchyviewer tool to look at the landscape view. If you want to rotate the screen using the emulator type * Fn + Ctrl + F12* on your Mac. Now you will see the fragment app flip. Now go back to the hierarchyviewer GUI, return to the pane called -- window selection view -- (bottom left, first icon) to reload the fragment activity and then switch back to the tree view. You should see the landscape tree view below.
Note, it has the two fragments as a horizontal layout as defined by the XML below
The landscape UI and its tree structure above correspond to res/layout-land/fragment_layout.html below.
~~~{.java}
~~~
The hierarchyviewer shows the horizontal layout of the two fragments -- they are represented in the tree as two FragmentLayouts with equal weight in the horizontal presentation in landscape -- see the XML ` android:layout_weight="1"`. The textview which renders the text "So shaken .." is highlighted, as show also in the emulator screen dump below.
If the user clicks on one of the items in the list then the `DetailsActivity` is started. If use the emulator and we go back to the hierarchyviewer tool again we will see the following in the window selection view of the tool: two activities executing (there are others but we are interested in the fragment app); that is, `DetailsActivity` and `FragmentLayout` -- each activity has its associated fragment and you can see these fragments using the tool.
Let's click on `DetailsActivity` in the window selection and switch to the tree view. The screen dump only shows a potion on the activities view hierarchy -- but enough to be of interest.
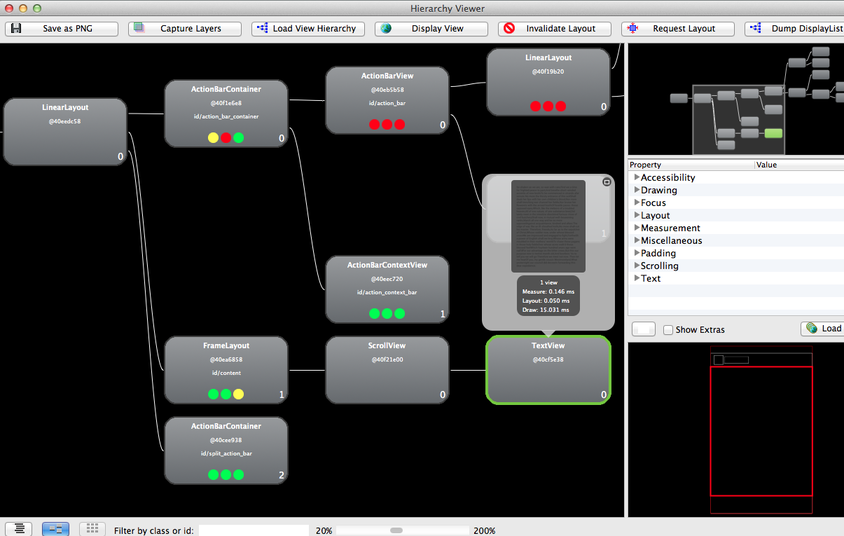
The `root view` given by R.id.contents (where the fragment is loaded) is clearly the root LinearLayout representing a ViewGroup with ActionBarContainer at the top of the screen (which includes the icon and name:fragments), then the FrameLayout where our details fragment has been added (including a ScrollView and TextView -- you can see the actual text added too), and finally another ActionBarContainer at the bottom (which has the back button, home button, and recent apps). So the fragment is added to the `root` ViewGroup and fills the screen).
You can learn quite a lot from loading the Fragment app using the emulator and playing with the hierarchyviewer tool and playing with app and seeing the various ViewGroup in terms of tree view; that is, the hierarchy of views all knitted together. Have fun! Really.