


Next: Estimation Algorithm
Up: Dataset
Previous: Preprocessing
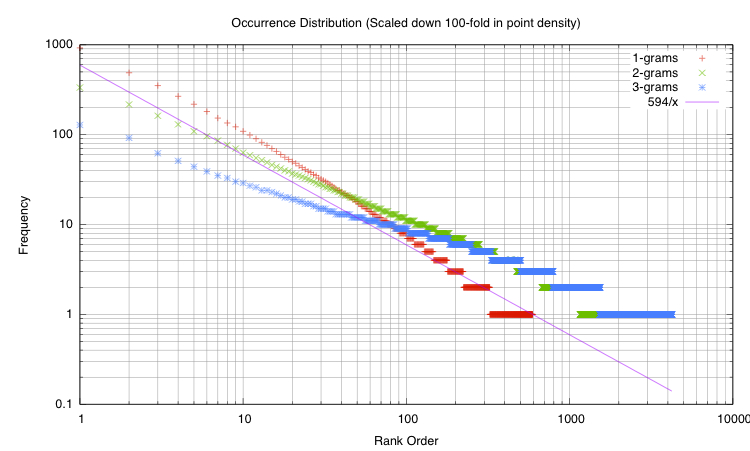
To sanity check the word distribution of the dataset, we plotted its
 -gram frequencies and compared it to Zipf's Law. Standard
linguistic texts should follow Zipf's Law for frequency distributions,
which says that a few events occur with high frequency and a number of
events occur with low frequency [9].
Figure 3 shows that our email text seems to follow
Zipf's Law.
-gram frequencies and compared it to Zipf's Law. Standard
linguistic texts should follow Zipf's Law for frequency distributions,
which says that a few events occur with high frequency and a number of
events occur with low frequency [9].
Figure 3 shows that our email text seems to follow
Zipf's Law.
Figure 3:
Comparing
-gram frequencies to Zipf's Law. We
sanity check our data to see if it follows the pattern we expect:
Zipf's Law. The probability mass plot shows that
-gram
frequencies of our dataset follow the Law. We plotted the Zipf
line using an exponent of  . To facilitate plotting, we
filtered the vocaulary size down by two orders of magnitude to
. To facilitate plotting, we
filtered the vocaulary size down by two orders of magnitude to
 elements for each
-gram set.
elements for each
-gram set.
 |
jac
2010-05-11